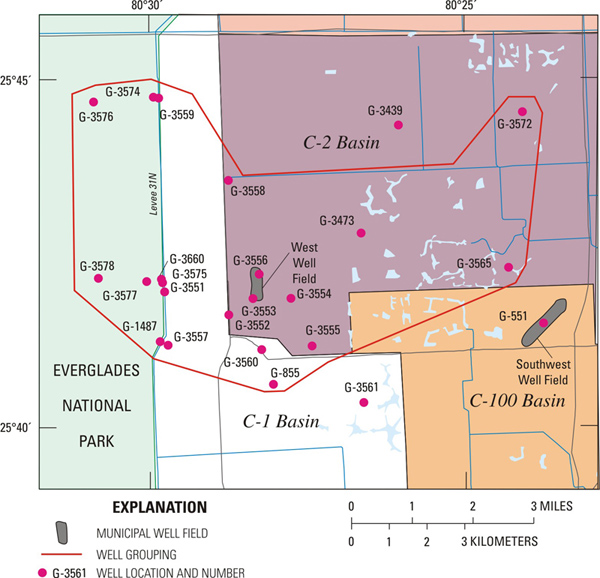
Figure 10.
Map showing grouping of wells near the West Well Field based on average correlation of water-level data during both wet and dry seasons.
close window