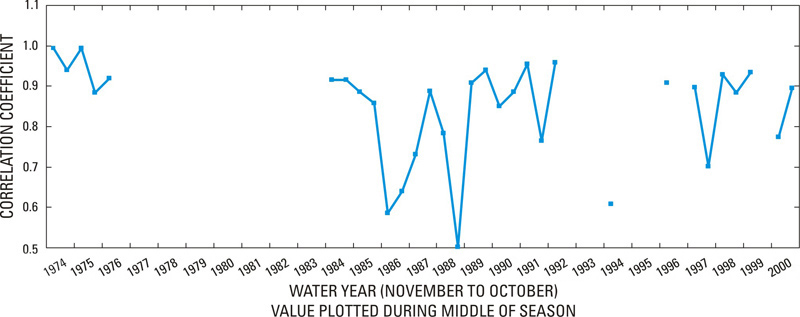
Figure 11.
Graph showing temporal variation in seasonal correlation between water-level data from well
G-1487
and that of well
G-855
during water years 1974-2000.
close window