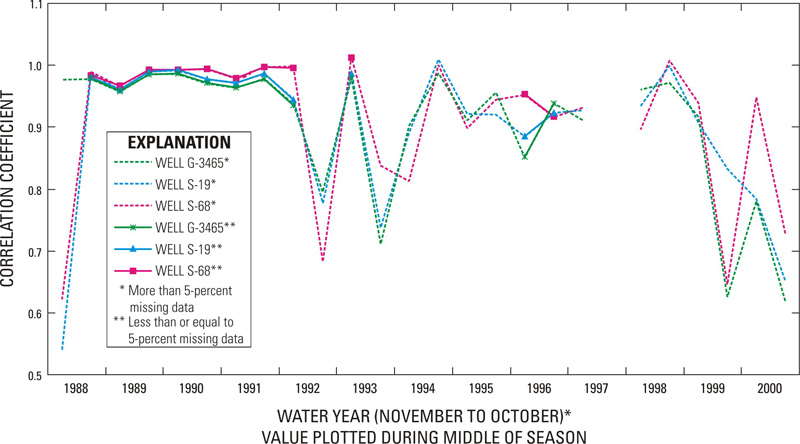
Figure 17.
Graph showing temporal variation in seasonal correlation between censored and uncensored water-level data from well
G-3466
and that of wells
G-3465
,
S-19
, and
S-68
during water years 1988-2000.
close window