> U.S. Geological Survey Open-File Report 2004-1416, Coastal Vulnerability Assessment of Dry Tortugas National Park (DRTO) to Sea-Level Rise , Figure 4, Index map for historic shoreline change figures.
Skip past header information
USGS Logo with link to USGS Web page
National Park Service Logo and link to Web site
Coastal Vulnerability Assessment of Dry Tortugas National Park (DRTO) to Sea-Level Rise
USGS Open-File Report 2004-1416


Back to Title Page


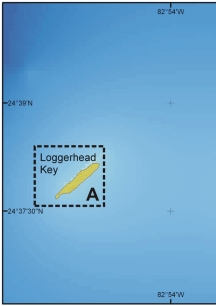
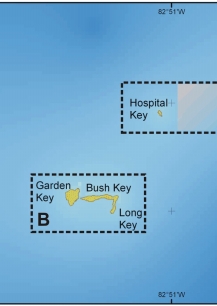
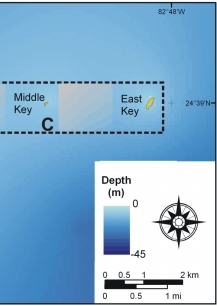
Figure 4.   Index map for historic shoreline change figures. Click on a box for a detailed view of historic shoreline change on A) Loggerhead Key, B) Garden Key, Bush Key, and Long Key, and C) Hospital Key, Middle Key, and East Key. Grey shaded areas are water and have been removed from the shoreline change figure.


Figure 4. Index map for historic shoreline change figures. Figure 4. Index map for historic shoreline change figures. Figure 4. Index map for historic shoreline change figures.
Loggerhead Key. Hospital Key. Garden, Bush and Long Key. Middle and East Key.
Skip Footer Information [an error occurred while processing this directive]