 |
Coastal Vulnerability Assessment of Dry Tortugas National Park (DRTO) to Sea-Level Rise
USGS Open-File Report 2004-1416
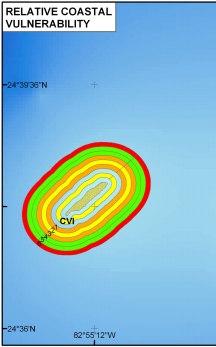
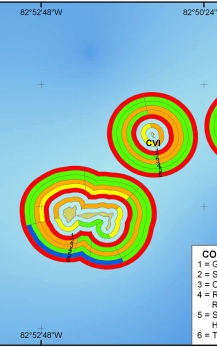
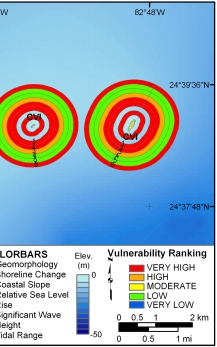
Figure 5. Relative Coastal Vulnerability for Dry Tortugas National Park. The innermost color bar is the relative coastal vulnerability index (CVI). The remaining color bars are separated into the geologic variables (1-3) and physical process variables (4 - 6). The very high vulnerability shoreline is located on East Key and Middle Key where rates of shoreline change have been highest. The low vulnerability shoreline is located on the south side of Bush Key and the west side of Long Key, where wave energy is low. | ||
 |
 |
 |
