 |
|
|
||||
| Open-File Report 2004–1425 |
Methods of Data Collection and Analysis
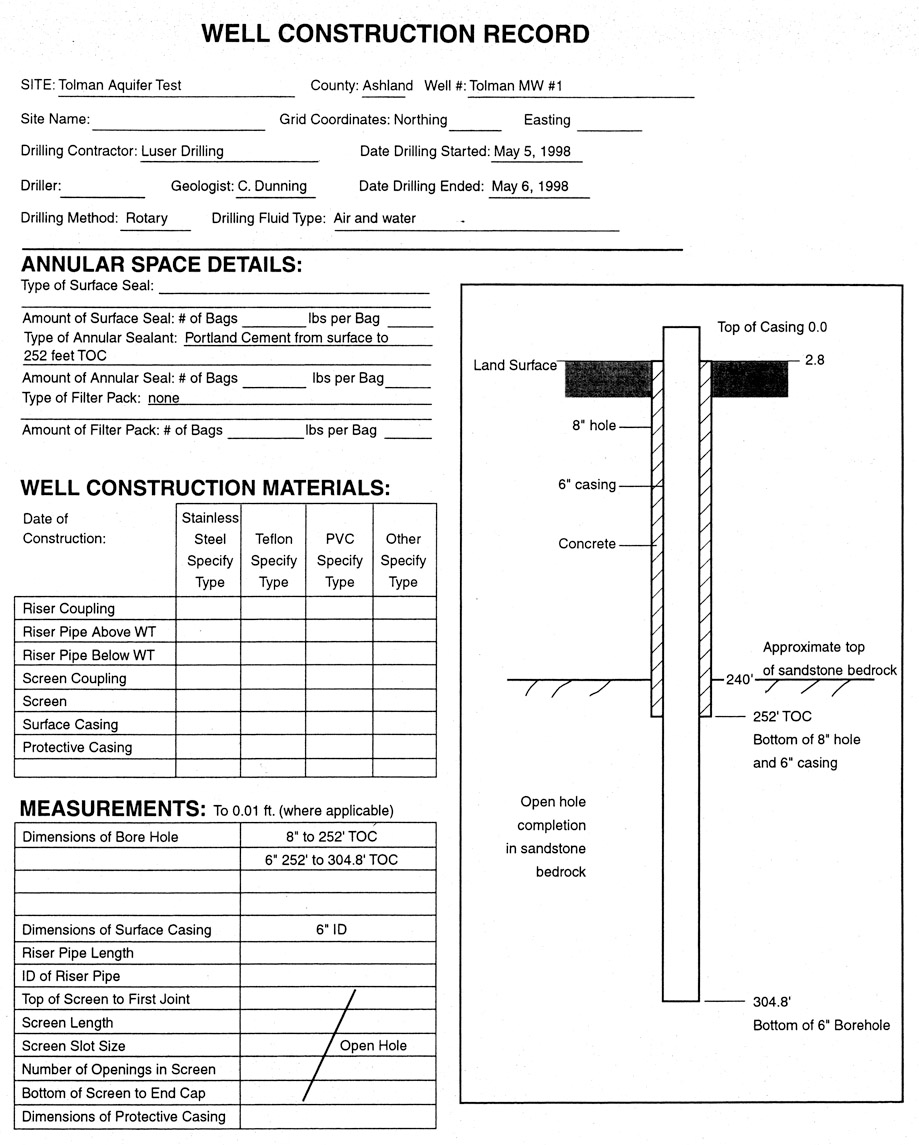
Appendix A. Well construction records.
Appendix B. Results of thin-section and porosity analysis.
Appendix C. Geophysical logs—Caliper log and electric logs from the ...
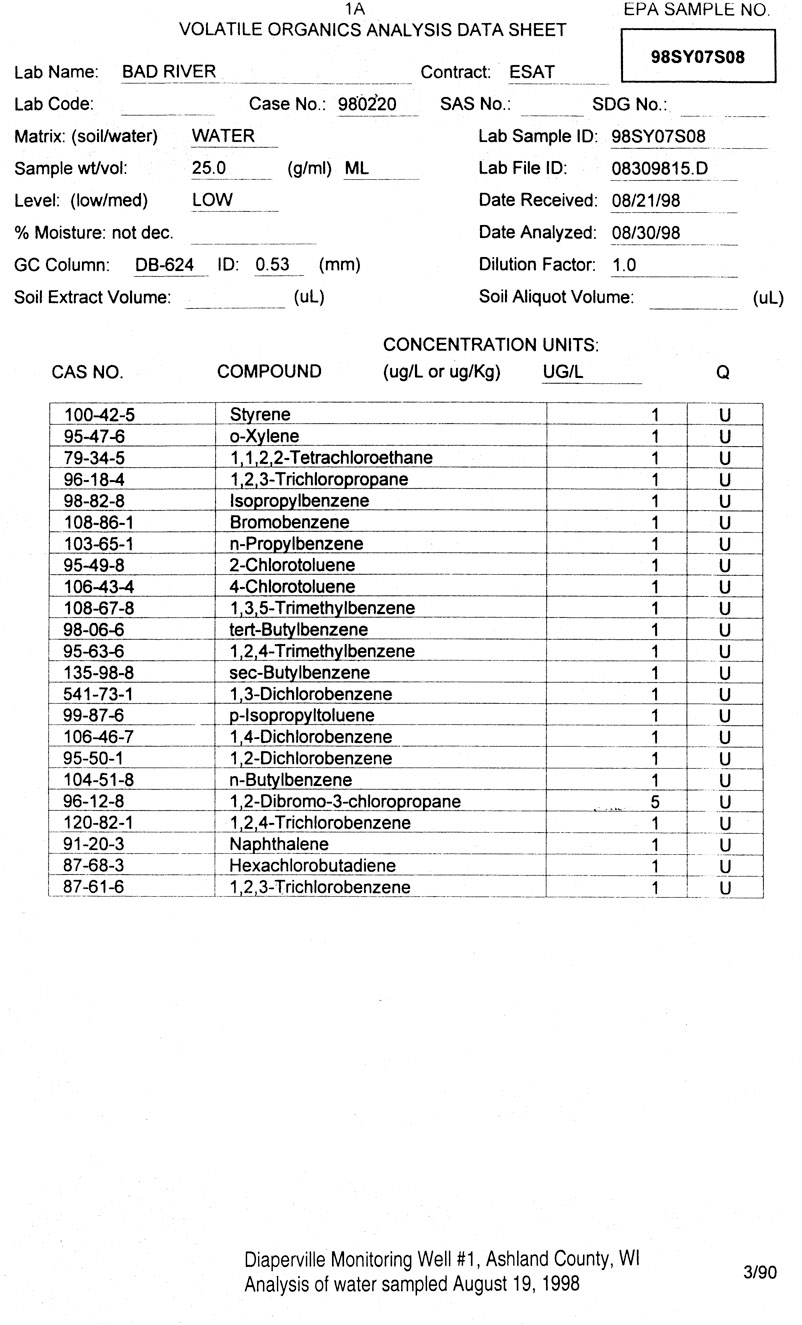
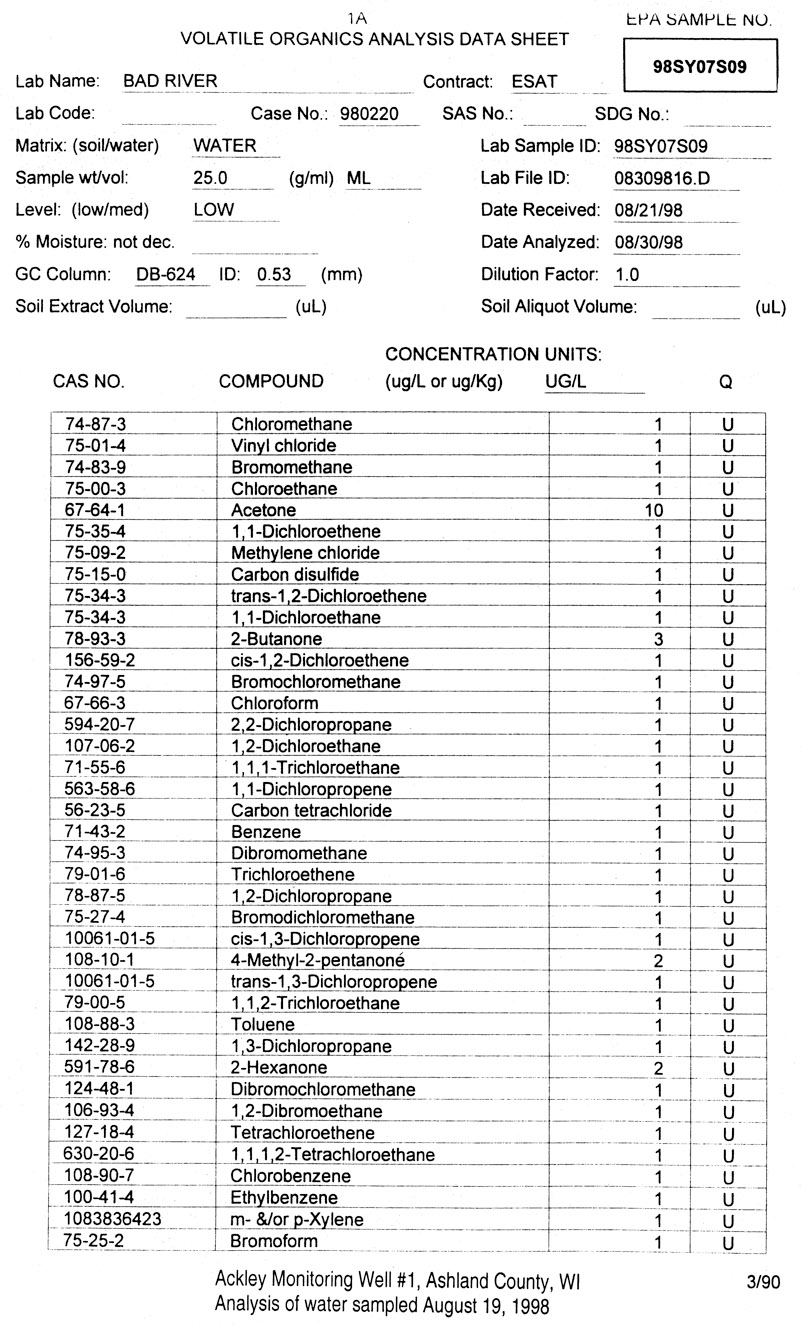
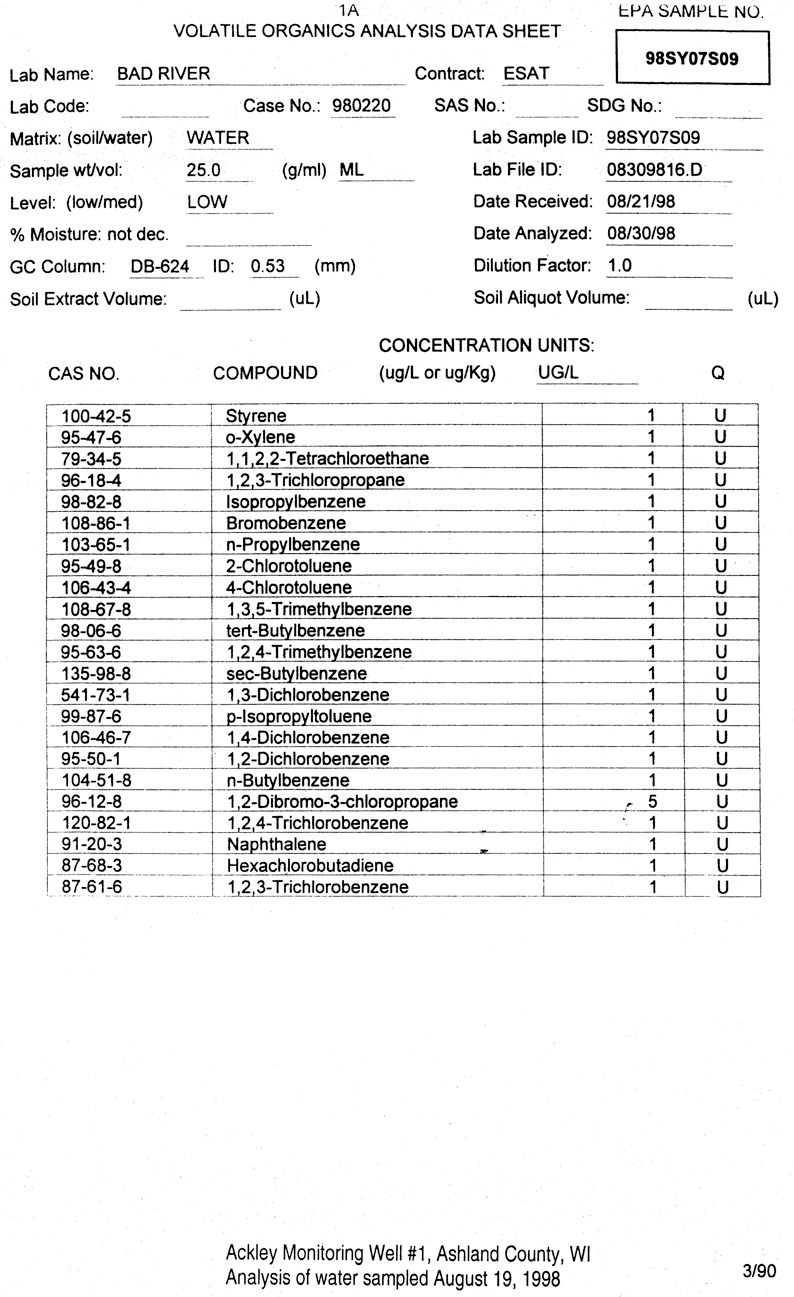
Appendix D. Results of Volatile Organic Analyses for Diaperville Mon...
Figure 1. Location of the Bad River Indian Reservation in northern W...
Figure 2. Stratigraphic section for the northern Bad River Indian Re...
Figure 3. Location of the Superior Lowland of the Lake Superior Regi...
Figure 4. Idealized geologic section and conceptualized ground-water...
Figure 5. Approximate locations of wells at the Diaperville Monitori...
Figure 6. Diagrammatic cross-section of wells monitored during the ...
Figure 7. Diagrammatic cross-section of wells monitored during the ...
Figure 8. Time-drawdown plot of the Diaperville Monitoring Well #1 a...
Figure 9. Detailed time-drawdown plot of the Diaperville Monitoring ...
Figure 10. Time-drawdown plot of the Tolman Monitoring Well #1 aquif...
Table 1. Estimated altitudes of well-casing tops at the Diaperville ...
Table 2. Measurements of altitude, length, and distance for wells in...
Table 3. Measurements of altitudes, length, and distance for wells i...
Table 4. Description of split-spoon samples of glacial deposits at A...
Table 5. Description of sandstone core from Ackley Monitoring Well #...
Table 6. Results of ICP and INAA elemental analysis of samples from ...
Table 7. Calculations of transmissivity, storage, r/B, and hydraulic...
Table 8. Static water altitudes for wells involved in aquifer tests ...
Table 9. Calculations of transmissivity, storage, r/B, and hydraulic...
Table 10. Summary of hydraulic properties for the Precambrian sandst...
Table 11. Inorganic constituents of water sampled December 7, 1999 f...
| Multiply | By | To obtain |
|---|---|---|
| Length | ||
| inch (in.) | 2.54 | centimeter (cm) |
| foot (ft) | 0.3048 | meter (m) |
| Area | ||
| square foot (ft 2 ) | 0.09290 | square meter (m 2 ) |
| Volume | ||
| gallon (gal) | 3.785 | liter (L) |
| Flow rate | ||
| gallon per minute (gal/min) | 0.06309 | liter per second (L/s) |
| Specific capacity | ||
| gallon per minute per foot [(gal/min)/ft] | 0.2070 | liter per second per meter [(L/s)/m] |
| Hydraulic conductivity | ||
| foot per day (ft/d) | 0.3048 | meter per day (m/d) |
| Transmissivity* | ||
| foot squared per day (ft2/d) | 0.09290 | meter squared per day (m2/d) |
Temperature in degrees Celsius (°C) may be converted to degrees Fahrenheit (°F) as follows:
°F=(1.8x°C)+32
Temperature in degrees Fahrenheit (°F) may be converted to degrees Celsius (°C) as follows:
°C=(°F-32)/1.8
Vertical coordinate information is referenced to the National Geodetic Vertical Datum of 1929 (NGVD 29) – a geodetic datum derived from a general adjustment of the first-order level of both the United States and Canada, formerly called Sea Level Datum of 1929.
Altitude, as used in this report, refers to distance above the vertical datum.
*Transmissivity: The standard unit for transmissivity is cubic foot per day per square foot times foot of aquifer thickness [(ft3/d)/ft2]ft. In this report, the mathematically reduced form, foot squared per day (ft2/d), is used for convenience.
Specific conductance is given in microsiemens per centimeter at 25 degrees Celsius (µS/cm at 25°C).
Concentrations of chemical constituents in water are given either in milligrams per liter (mg/L) or micrograms per liter (µg/L).
r/B represents the deviation from the standard Theis curve due to leakage; r/B and leakage are directly related.
The Precambrian sandstone aquifer in the northwestern part of the Bad River Band of Lake Superior Tribe of Chippewa Indians Reservation, Ashland County, Wisconsin, provides much of the drinking water to area residents. A study was undertaken in cooperation with the Bad River Tribe to provide specific information about the lithology, hydraulic properties, and water quality of the sandstone aquifer. During 1998 and 1999, the U.S. Geological Survey installed three monitoring wells, collected and analyzed lithologic and water samples, and conducted geophysical logging and aquifer tests to characterize the sandstone aquifer. The two monitoring wells in the southeastern part of the study area, the Diaperville Monitoring Well #1 (Diaperville MW #1) and the Tolman Monitoring Well #1 (Tolman MW #1), are believed to have encountered older Middle Proterozoic Oronto Group sandstones. The sandstone encountered in the Ackley Monitoring Well #1 (Ackley MW #1) is believed to be Chequamegon Sandstone of the Late Proterozoic Bayfield Group. This interpretation is based on previous studies, as well as thin-section analysis of sandstone core recovered from the Ackley Monitoring Well #1. Results of aquifer tests conducted in the Diaperville Monitoring Well #1 and the Tolman Monitoring Well #1 provide ranges for hydraulic parameter values in the sandstone aquifer: transmissivity ranges from 83 to 509 square feet per day; hydraulic conductivity ranges from 1.6 to 4.5 feet per day; storativity ranges from 0.00019 to 0.00046; and specific capacity ranges from 0.22 to 0.67 gallons per minute per foot. Though high- and low-angle fractures are present in Ackley Monitoring Well #1 core, the hydraulic properties of the bedrock appear to be due largely to the matrix porosity measured in thin section (16–21 percent) and permeability of the sandstone. The aquifer test for the Diaperville Monitoring Well #1 resulted in observed drawdown in nearby glacial wells, evidence of a hydraulic connection between the sandstone aquifer and the glacial deposits. Major ion analyses indicate that the water sampled from the sandstone aquifer at the Ackley site is of the calcium-magnesium-sodium-bicarbonate type. Based on a single sampling set, volatile organic constituents were not detected in water samples from the Diaperville Monitoring Well #1 or the Ackley Monitoring Well #1.
The Precambrian sandstone aquifer in the northwestern part of the Bad River Band of Lake Superior Tribe of Chippewa Indians Reservation (Reservation), Ashland County, Wisconsin, is a primary source of drinking water to area residents (fig. 1). Understanding the lithologic, hydraulic, and water-quality characteristics of this sandstone aquifer is necessary for the Tribe to protect and manage this important resource. A previous study by Batten and Lidwin (1995) reported on hydrologic data collected across the Reservation from 1983 through 1987, including data on ground-water flow and ground-water quality. That compilation of existing data was an important step in generalizing the ground-water resource across the Reservation. However, detailed information on the sandstone aquifer in the northwestern part of the Reservation, the area containing the larger population centers, was lacking. A study was undertaken in cooperation with the Bad River Tribe to provide specific information about the lithologic, hydraulic, and water-quality characteristics of the sandstone aquifer in the northwestern part of the Reservation. As part of this study the U.S. Geological Survey (USGS) installed three monitoring wells in 1998 and 1999, collected and analyzed lithologic and water samples, and conducted geophysical logging and aquifer tests to characterize the sandstone aquifer. The objective of this study was to provide specific information about the sandstone aquifer in the northwestern part of the Bad River Reservation. Data were collected from 1998 to 2000 to address the following questions:
The purpose of this report is to describe the lithology, hydraulic properties, and water quality of the sandstone aquifer in the northwestern part of the Bad River Reservation. The descriptions are based on data collected from three monitoring wells from 1998 to 2000. This report summarizes the construction of the three monitoring wells, and describes bedrock and sediment cores, geophysical-log data, and the results of laboratory tests on selected core samples from the sandstone and overlying glacial deposits. Aquifer-test data are presented and analyzed. Results of water analyses for inorganic constituents, trace metals, and volatile organic compounds are presented.
The Bad River Indian Reservation encompasses parts of Ashland and Iron counties in northern Wisconsin (fig. 1). The general geologic setting consists of bedrock underlying about 100–200 ft of unconsolidated glacial and post-glacial deposits. The Middle Proterozoic Oronto, and Late Proterozoic Bayfield Groups compose the upper Precambrian bedrock in the northern part of the Reservation (fig. 2) (Mudrey and others, 1982). The Oronto Group is described as feldspathic sandstone with associated siltstone, shale, and conglomerate, and the Bayfield Group is described as feldspathic quartzose sandstone with some orthoquartzitic sandstone (Mudrey and others, 1982). The occurrence of the Bayfield sandstones within the Reservation is believed to be limited to its far northwestern corner (Batten and Lidwin, 1995).
The northwestern part of the Reservation lies within the area defined as the Superior Lowland of the Lake Superior Region (fig. 3) (Clayton, 1984). The Lake Superior Region was glaciated many times during the Pleistocene, though evidence is abundant only for the last part of the Wisconsin Glaciation, which began about 20,000 years before present. During this glaciation, the Superior and Chippewa Lobes advanced over the Lake Superior Region. Glacial deposits that overlie the Precambrian sandstone comprise the Copper Falls Formation (sandy glacial and stream deposits) and the younger Miller Creek Formation (clayey glacial and offshore deposits) (fig. 2). Post-glacial deposits include Holocene soil and alluvial deposits.
The topography of the northern Reservation is described as lake-modified glacial topography (Clayton, 1984). This topography is subdued as the result of wave action, or as the result of sediments deposited in a water-logged state during high stages of Lake Superior. The land surface is of low relief, with hummocky, collapsed topography in most places, but drumlinized in some areas.
The hydrogeologic setting of the northwestern part of the Bad River Indian Reservation is defined by the glacial deposits and the underlying sandstone. A shallow discontinuous silty-sand and sand aquifer overlies the massive red clay of the Miller Creek Formation (Batten and Lidwin, 1995). The underlying Copper Falls Formation directly overlies the sandstone bedrock (fig. 2). Water used by residents of the Reservation comes primarily from wells that pump from the regional sandstone aquifer, but in some areas wells also pump from sand and gravel zones in the Copper Falls Formation. Depending on its thickness and nature, the clay in the Miller Creek Formation may act as a confining or semi-confining unit to the deeper, sandstone aquifer. An idealized north-south geologic section and conceptualized ground-water-flow system across the Reservation (fig. 4) is presented by Batten and Lidwin (1995).
The author would like to acknowledge the contributions of the following people and organizations: Tracey Ledder, Matthew Eitrem, and Kirsten Cahow of the Bad River Natural Resources Department provided assistance in all phases on the project. Dr. Richard Ojakangas, of the University of Minnesota–Duluth, provided interpretation of thin sections taken from the Ackley MW #1 sandstone core. Bernie Ellefson and John DeWild, USGS Wisconsin Water Science Center, instrumented the Ackley MW #1 and sampled for water-quality analysis. James Rauman, Jemuel Ripley and Paul Juckem provided the expertise for hard-rock and split-spoon coring of the Ackely MW #1, and expertise for aquifer testing of the Diaperville MW #1 and the Tolman MW #1. USGS geophysical crew provided equipment and expertise for geophysical logging of all three monitoring wells. Technical review of the report was provided by Faith Fitzpatrick of the USGS Wisconsin Water Science Center and Kenneth Bradbury of the Wisconsin Geological and Natural History Survey. Additional review comments were provided by James Krohelski of the USGS Wisconsin Water Science Center.
Data from the three monitoring wells installed for this study were analyzed and evaluated to provide a basis for a detailed characterization of the Precambrian sandstone aquifer. Lithologic data were collected through geophysical logging, and chemical and thin-section analysis of bedrock and unconsolidated core. Hydraulic data were collected from nearby existing domestic, community, and abandoned wells during aquifer tests conducted in two of the three monitoring wells. Samples for water-quality analysis for inorganic and organic constituents were collected from two of the three monitoring wells.
Three monitoring wells were installed in the northwestern part of the Reservation, the area where many of the residents live. The locations for the three wells were chosen in cooperation with the Bad River Tribe after taking into consideration drilling requirements, land ownership, and site access. The three wells are named Diaperville MW #1, Tolman MW #1, and Ackley MW #1 (figs. 1 and 5).
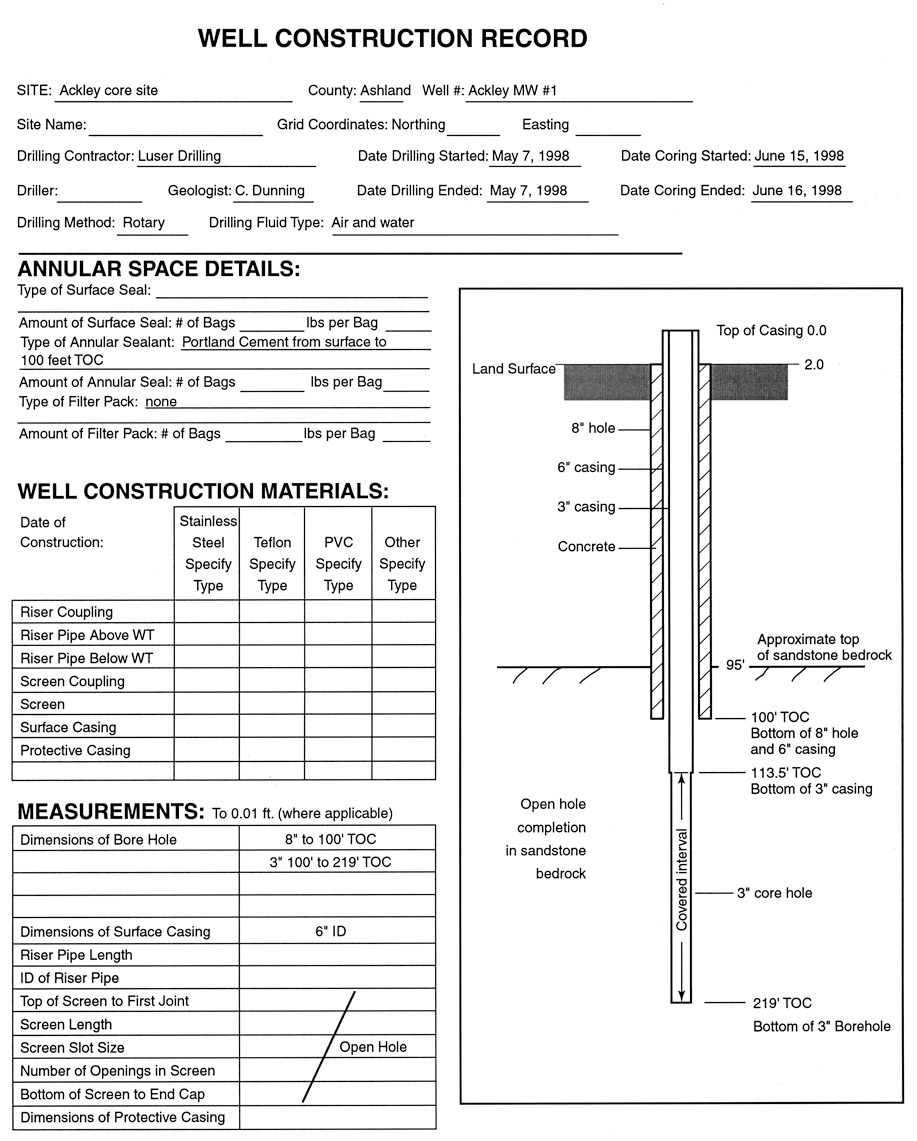
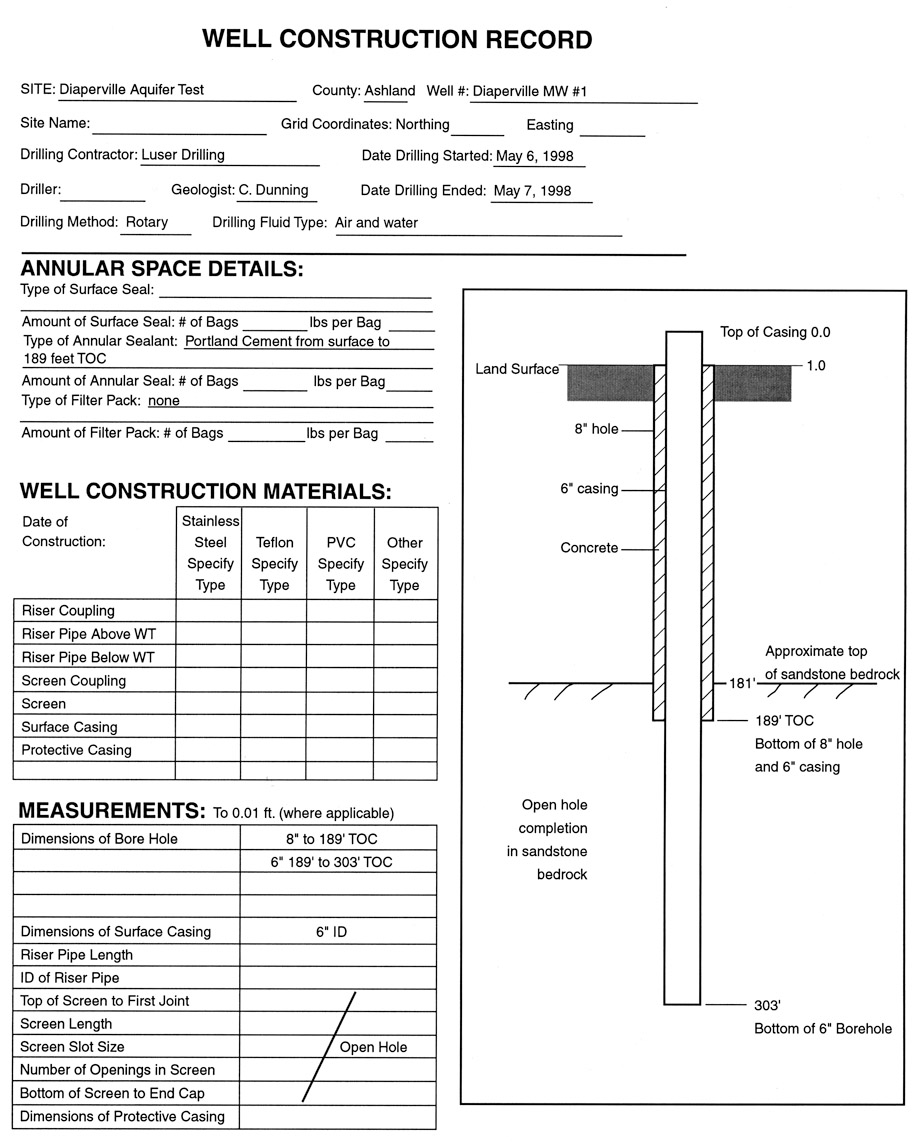
The wells were drilled during May of 1998 by TD Drilling of Lena, Wisconsin. Two wells, the Diaperville MW #1 and Tolman MW #1, were completed by setting 6-in. casing through the glacial deposits and leaving the sandstone portion of the well bore uncased. Total depth for both wells is 302 ft below ground surface (bgs). The Ackley MW #1 was completed just into the top of the sandstone with the bottom of 6-in. casing set at total depth of 98 ft bgs. Subsequently a 3-in. casing string was set to 113.5 ft bgs. Then the sandstone in the Ackley MW # 1 was cored by the USGS from the bottom of the 3-in. casing to a new total depth of 217 ft bgs. No aquifer test was conducted at the Ackley site because the cored hole was not large enough to accommodate the pump, and it lies farther from population centers of Diaperville and Odanah (fig. 1). Well-construction records for the three monitoring wells are in Appendix A.
A survey to measure relative altitudes of top of casing (TOC) for all the wells involved in the aquifer tests was carried out using a surveying level on June 30, 1999. At the Diaperville site, not all the observation wells could be surveyed from a single location, so calculations involve turning points and new locations for the level. The measured differences in TOC altitude and the resulting approximated altitudes for each well at the Diaperville and Tolman sites are listed in table 1.
The differences in altitude between the tops of well casings can be measured quite precisely, to a few hundredths of a foot; however the ground altitudes above the National Geodetic Vertical Datum of 1929 (NGVD 29) at the two sites (Diaperville MW #1 and the Tolman MW #1) were approximated from USGS topographic maps. In the future, if the monitoring wells are surveyed for precise altitude above NGVD 29, the approximated altitudes of the observation wells can be adjusted accordingly.
[TOC; top of casing; NGVD 29, National Geodetic Vertical Datum of 1929; –, not estimated; MW, monitoring well; CW, community well]
| Well | Estimated ground altitude (in feet above NGVD 29) | Surveyed difference between ground elevation and TOC (in feet) | Estimated altitude of TOC (in feet above NGVD 29) |
|---|---|---|---|
| Diaperville MW #1 | 610 | 1.00 a | 611.00 |
| Diaperville CW #2 | – | + 2.10 | 613.10 |
| Big Boy | – | + 0.94 | 611.94 |
| Hand pumped | – | + 2.03 | 613.03 |
| Tolman MW #1 | 655 | 2.80 b | 657.80 |
| DeGodt | – | + 1.52 | 659.32 |
a Top of casing is measured by tape to be 1.00 feet above the ground
b Top of casing is measured by tape to be 2.80 feet above the ground
A cursory lithologic description of the sandstone core collected from Ackley MW #1 was done at the USGS drilling warehouse in Middleton. Selected intervals of the sandstone core from the Ackley MW #1 were evaluated in thin section by Dr. Richard Ojakangas of the University of Minnesota–Duluth. Glacial deposits were sampled at the Ackley MW #1 site using split-spoon coring. Because of difficult drilling conditions at depth, coring of the glacial sequence was halted above the top of the bedrock, so the nature of the coarser zones expected near the bottom of the Copper Falls formation could not be evaluated. The Bad River Tribe requested that samples of clayey-silty zones in the bedrock core at depths of about 147 and 165 ft bgs be submitted for chemical analysis to determine whether any naturally occurring thorium or antimony in these zones could be a source for elevated thorium and antimony reportedly found in water from bedrock wells in the northeastern corner of the Reservation (T. Ledder, Bad River Natural Resources Department, 2000, personal commun.). These analyses were conducted at the USGS Geology Discipline facilities in Denver using an induction coupled plasma (ICP) mass spectrometer and an instrumental neutron activation analysis (INAA) (USGS TRIGA reactor). In addition, the Bad River Tribe sampled selected intervals of the glacial deposits between 4 and 60 ft bgs and submitted the samples to their contract laboratory for metals and dioxin analysis.
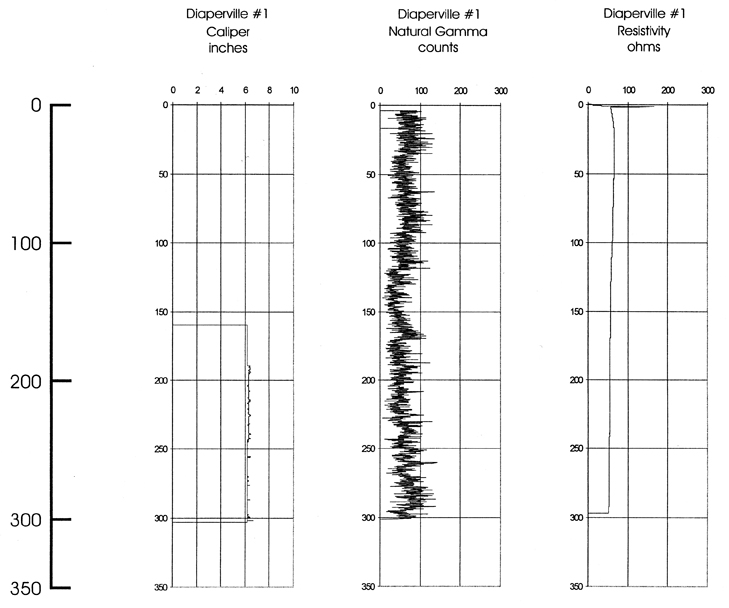
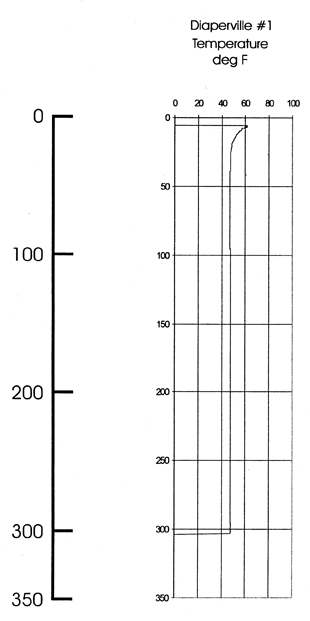
The three monitoring wells were geophysically logged during August of 1998 by the USGS Borehole Geophysics Research Project. Some combination of caliper, natural gamma, formation resistivity, fluid resistivity, and temperature logs was run in all three wells (Keys, 1990). The long- and short-normal fluid resistivity log was not run in the Ackley MW #1 because of the smaller hole diameter. Instead, the induction tool was run (Fred Paillet, U.S. Geological Survey, 1999, written commun.). In addition, a heat-pulse flow-meter was run in all three wells (Keys, 1990). The heat-pulse flow-meter logs were analyzed by fitting the discrete flow points (every 5 ft) to straight line segments (Fred Paillet, U.S. Geological Survey, 1999, written commun.). The proportion of total inflow from each 5-foot interval was estimated from the total production. Interval thickness was used to convert transmissivity values determined from heat-pulse flow-meter analysis to horizontal hydraulic conductivity (Kh) for each subzone.
Aquifer tests were conducted at the Diaperville and Tolman sites during the last week of June, 1999. The Diaperville test was conducted on June 25 and 26, and the Tolman test was conducted on June 28 and 29. An aquifer test is used to estimate aquifer hydraulic characteristics (Stallman, 1971) and is conducted by measuring water-level changes in response to sustained pumping from the aquifer. Existing domestic, community, and abandoned wells at the Diaperville and Tolman sites (fig. 5) were used for measuring water-level changes. Because existing wells were used, their construction, condition, and distance from the pumped well were pre-determined and could not be dictated by aquifer-test design. In general, the greater the duration of an aquifer test, the closer the aquifer will come to equilibrate to the imposed stress. Due to project budget constraints, the aquifer tests at the Diaperville and Tolman sites were limited to a 24-hour duration. Calculation of anticipated drawdown at the pumped and observation wells were made and used for initial placement of pumps and transducers. Well development and step drawdown tests prior to each aquifer test provided measured drawdowns and an opportunity to reposition the pump or transducers if necessary.
A pumping test of the sandstone aquifer was conducted in the Diaperville MW #1. Three nearby wells were available to measure water-level changes during the aquifer test (fig. 5). The community of Diaperville has two community wells completed in the sandstone, Diaperville Community Wells #1 and #2 (Diaperville CW #1 and #2). The two wells alternate pumping to provide water to the community. CW #2 is closest to Diaperville MW #1 and was used to measure water-level changes in the sandstone during the aquifer test. The other two observation wells are completed in the glacial deposits, the Big Boy well (active domestic) and the Hand Pump well (abandoned) (fig. 5). A diagrammatic cross-section of the wells included in the Diaperville aquifer test (fig. 6) shows estimated altitudes of TOC, the completed interval of each well, non-directional distance from the pumping well, and the inferred contact between the unconsolidated glacial deposits and the sandstone. Because the extent of the hydraulic connection between the sandstone and overlying glacial deposits is not known, it could not be predicted whether drawdown would be observed in the glacial wells during the aquifer test. The two glacial observation wells were closest to the pumped well, at 126- and 247-ft distance. The sandstone observation well was the most distant at 480 ft. Additional details are included in table 2. The pump end used was a Jacuzzi Sand-handler (60 gal/min) and the pump motor was a Franklin 3 hp. The altitude of the pump inlet was 449 ft and there was a check valve in place above the pump. The pumped water was piped 85 ft from well head and discharged over a berm beyond which the slope of the land carries water further from the well.
[Altitudes are estimated in feet above the National Geodetic Vertical Datum of 1929, lengths and distances are in feet; –, not applicable to this well]
| Pumped well (Diaperville Monitoring Well #1) | Sandstone observation well (Diaperville Community Well #2) | Glacial deposit observation wells | |||
|---|---|---|---|---|---|
| Four-inch hand-pumped well | Big Boy private well | ||||
| Altitudes | |||||
| Top of casing | 611.00 | 613.10 | 613.03 | 611.94 | |
| Bottom of well | 308.00 | 313.10 | 476.23 | 474.54 | |
| Bottom of 6-inch casing | 422.00 | 400.10 | 480.23 | 477.54 | |
| Top of sandstone (estimated) | 430 | 403 | – | – | |
| Placement of pressure transducer | 491 | 604 | 605 | 607 | |
| Lengths and distances | |||||
| Length of open interval in sandstone | 114 | 87 | – | – | |
| Length of screen in glacial deposits | – | – | 4 | 3 | |
| Distance from pumping well | 0 | 480 | 126 | 247 | |
A pumping test of the sandstone aquifer was conducted in the Tolman MW #1. One observation well, the DeGodt well, was available to measure water-level changes (fig. 5). Additional details for these two wells are included in table 3. Because of shallow obstructions it was not possible to measure water levels in a nearby private well (312 ft distance) completed in the glacial deposits. A diagrammatic cross-section of the wells included in the Tolman aquifer test (fig. 7) show estimated altitudes of TOC, the completed interval of each well, non-directional distance from the pumping well, and the inferred contact between the unconsolidated glacial deposits and the sandstone. The pump end used was a Jacuzzi Sand-handler (60 gal/min) and the pump motor was a Franklin 3 hp. The altitude of the pump inlet was 423 ft and there was a check valve in place above the pump. The pumped water was piped 20 ft from well head and discharged where the slope of the land carries water farther from the well.
[Altitudes are estimated in feet above the National Geodetic Vertical Datum of 1929; lengths and distances are in feet]
| Pumped well (Tolman Monitoring Well #1) | Sandstone observation well (DeGodt well) | |
|---|---|---|
| Altitudes | ||
| Top of casing | 657.80 | 659.32 |
| Bottom of well | 353.00 | 362.32 |
| Bottom of 6-inch casing | 405.80 | 392.32 |
| Top of sandstone (estimated) | 418 | 418 |
| Placement of pressure transducer | 443 | 579 |
| Lengths and distances | ||
| Length of open interval in sandstone | 53 | 30 |
| Distance from pumping well | 0 | 203 |
Hydraulic properties of the sandstone aquifer are inferred from the drawdown at observation wells in response to pumping. Different analytical solutions to ground-water flow equations can be used to relate hydraulic properties to the pumping response. The Hantush-Jacob (1955) solution for transient, radial, and vertical ground-water flow as a result of pumping in a leaky aquifer has been used to analyze these two aquifer tests. This solution takes into account the water that may be moving from the glacial deposits into the sandstone aquifer during the stress of pumping. Assumptions for this solution are:
The time-drawdown observed in the sandstone observation wells, Diaperville CW #2 and DeGodt, were evaluated using the Hantush-Jacob solution to calculate values for transmissivity (T) and storativity (S) in the sandstone aquifer. Evaluation was performed manually using chart overlays, and also using the commercially available software Aqtesolv (Geraghty & Miller, Inc., 1989). Horizontal hydraulic conductivity (Kh) is calculated as T divided by the saturated thickness of the aquifer. However, the saturated thickness of the Precambrian sandstone aquifer in the northwestern part of the Reservation is unknown; for these analyses saturated thickness has been assumed to be the open interval of the pumping well–114 ft for the Diaperville MW #1 and 53 ft for the Tolman MW #1. If actual saturated thickness is greater, the calculated Kh would be proportionally lower.
Hantush (1960) provides a modification to the above solution that is particularly appropriate for a thick, low permeability confining bed that is highly compressible. However, that solution requires multiple observation wells in the sandstone which could not be provided at either of the aquifer test sites.
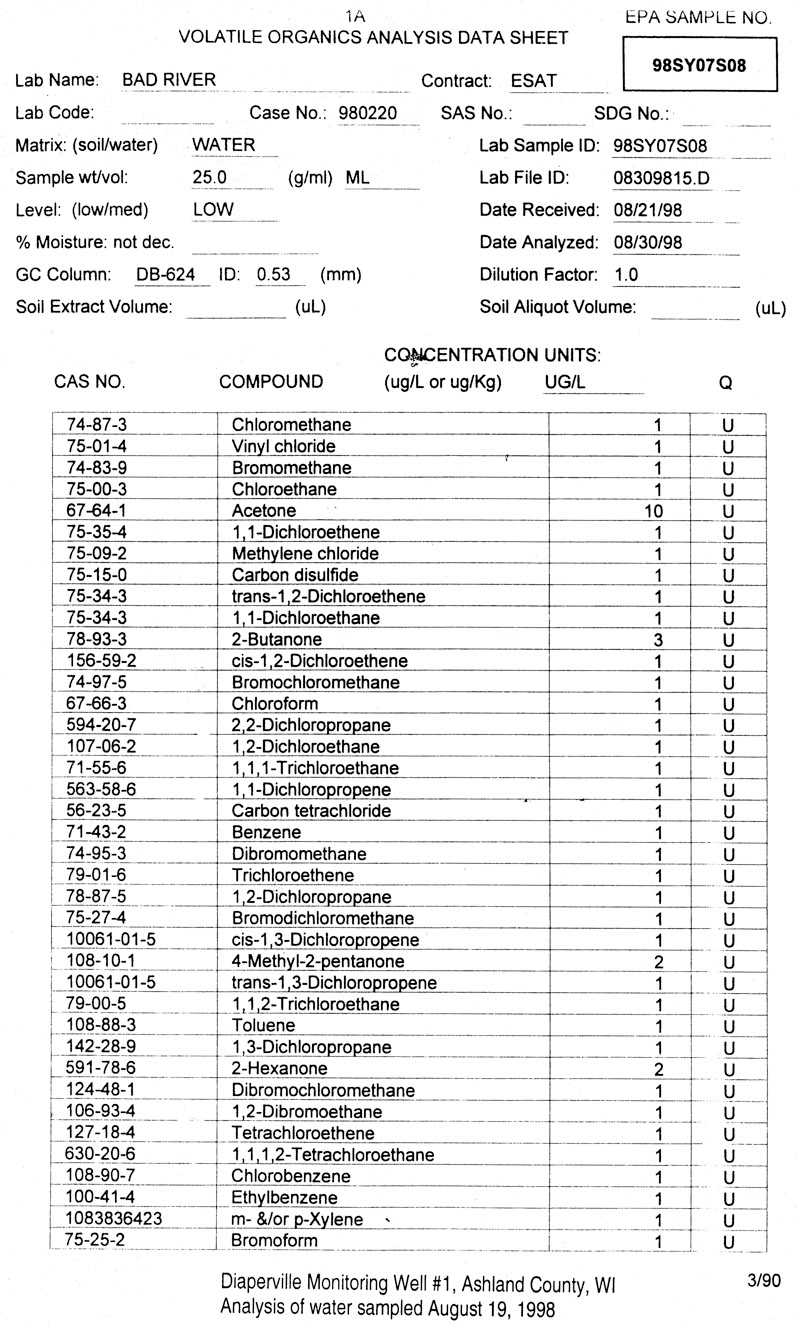
Water samples collected on August 19, 1998 from the sandstone aquifer in the Diaperville MW #1 and Ackley MW #1 were submitted to the ESAT Laboratory, a U.S. Environmental Protection Agency (USEPA) contract laboratory, for volatile organic analysis (VOA). Water samples collected on December 7, 1999 from the sandstone aquifer in the Ackley MW #1 were submitted to the USGS National Water Quality Lab in Denver, Colorado for determination of major inorganic ions.
Lithologic, water-quality, geophysical, and aquifer-test data were collected and analyzed to provide specific information about the Precambrian sandstone aquifer in the northwestern part of the Bad River Reservation.
The three monitoring wells installed for this study all encountered a similar sequence of unconsolidated deposits: a relatively thin layer of soil overlying the thick red clays of the Miller Creek Formation which in turn overlie the Copper Falls Formation. Split-spoon cores of the glacial deposits recovered from the Ackley MW #1 site provide a detailed record of the sequence (table 4). The deposits encountered are uniformly red clay till with varying amounts of sand and pebbles. Cursory evaluation of bedrock core from the Ackley #1 well indicates sandstone that is primarily reddish brown but ranges from brownish red to light brown; the different colors are often layered or mottled (table 5). Some inclusions of red clay or silt are present. Occasional high-angle fractures are found, and numerous low-angle fractures or bedding partings are present. The sandstone is generally well-cemented but is very friable in places. Thin-section analysis measured porosity ranging from 16–21 percent (R. Ojakangas, University of Minnesota–Duluth, 1999, written commun.)(Appendix B).
[ft, feet; mm, millimeters; %, percent; --, interval drilled, not cored]
| Core | Cored interval (ft below ground surface) | Recovery (ft) | Description |
|---|---|---|---|
| A | 0.0 – 4.5 | 2.9 ft | Red clay till with < 10% sand. |
| B | 4.5 – 9.5 | 5.0 ft | Red clay till with sand lenses. Relatively more moist and compact than core A. |
| C | 9.5 – 14.5 | none | |
| D | 14.5 – 19.5 | 2.2 ft | Red clay till with significant abundance of pebbles. |
| E | 19.5 – 24.5 | 2.4 ft | Red clay till with significant abundance of pebbles. |
| F | 24.5 – 29.5 | 1.9 ft | Red clay till with pebbles and cobbles, less sandy than core E. |
| G | 29.5 – 34.5 | 1.4 ft | Red clay till, sandier with relatively fewer pebbles and cobbles. |
| H | 34.5 – 39.5 | 5.0 ft | Red clay till with few cobbles, lenses of white Quartz grains. |
| I | 39.5 – 44.5 | 1.6 ft | Red clay till with less clay and generally less coarse material, but some large pebbles (> 10 mm). |
| J | 44.5 – 49.5 | 5.0 ft | Red clay till with relatively more clay, core has become wetter. |
| K | 49.5 – 54.5 | 3.0 ft | Red clay till, silty, with common pebbles (1–10 mm). |
| L | 54.5 – 59.5 | 4.8 ft | Red clay till, relatively sandier, small pebbles in core end. |
| M | 59.5 – 61.3 | 1.8 ft | Red clay till, very sandy. |
| -- | 61.3 – 64.0 | 2.7 ft | Drill through interval due to difficulty augering. |
| N | 64.0 – 65.3 | 1.3 ft | Red clay till, very sandy (coarse sand) with clasts of broken sandstone. |
| -- | 65.3 – 70.3 | 5.0 ft | Because of refusal of the auger beyond 65.3 ft, the hole was drilled through this interval. Due to hole conditions operations were ended at 70.3 ft. |
Table 5. Description of sandstone core from Ackley Monitoring Well #1 site, Ashland County, Wis.
| Core | Cored interval (feet below ground surface) | Description |
|---|---|---|
| A | 114.4 – 117 | Sandstone, fine to med grained, reddish brown with light brown mottling, bedding plane parting, single high-angle fracture, competent but friable. |
| B | 117 – 127 | Sandstone, fine to med grained, light brown at top grading into mottled reddish brown and light brown, lower 8 ft is uniformly reddish brown, at ~ 123 feet a sandy clay interval, occasional bedding plane parting, several rubbled zones, single high angle fracture. |
| C | 127 – 137 | Sandstone, fine to med grained, transition to generally light brown mottled with reddish brown, between ~ 130.0 and 130.5 a section of brownish red sandstone, to 137.0 is uniform light brown and reddish brown, competent but friable. |
| D | 137 – 147 | Sandstone, fine to med grained, uniform reddish brown interbedded and mottled with light brown, several low angle fractures or bedding partings. |
| E | 147 – 157 | Sandstone, fine to med grained, continued uniform reddish brown, competent but less friable than above, increasing light brown mottling ~153.0 to 156. |
| F | 157 – 167 | Sandstone, fine to med grained, continued reddish brown, competent, occasional red clay or silt inclusions and thin layers, low angle fractures or bedding partings. |
| G | 167 – 177 | Sandstone, fine to med grained, many distinct reddish brown and light brown alternating layers, also light brown mottling, ~174 to 177 more uniform reddish brown, low angle fractures and bedding partings, competent. |
| H | 177 – 187 | Sandstone, fine to med grained, reddish brown, several intervals of course poorly sorted sandstone with high angle bedding and darker red brown color. |
| I | 187 – 197 | Sandstone, fine to med grained, grading to slightly lighter reddish brown, distinct reddish brown and light brown alternating layers, occasional red clay or silt inclusions, low angle fracture and bedding partings. |
| J | 197 – 207 | Sandstone, fine to med grained, generally uniform reddish brown, several light brown bands and mottling. |
| K | 207 – 217 | Sandstone, fine to med grained, reddish brown as above, low angle fracture and bedding partings. |
The three monitoring wells have likely encountered two stratigraphically different sandstone units. The sandstone encountered at the Ackley MW #1 location is interpreted to be Chequamegon Sandstone of the Bayfield group based on thin section analysis (R. Ojakangas, University of Minnesota–Duluth, 1999, written commun.) (Appendix B). This is consistent with the lithologic descriptions of Mudrey and others (1982), and with the suggestion by Batten and Lidwin (1995) that the Bayfield Group sandstones are only present in the northwestern part of the Reservation. By contrast, these authors suggest that sandstones encountered at the locations of the Diaperville and Tolman sites would be of the older Oronto Group. Therefore, it is assumed that the aquifer tests at Diaperville and Tolman sites evaluate sandstone that is stratigraphically distinct from the sandstone described in core from the Ackley MW #1.
Of particular interest to the Tribe were concentrations of naturally occurring antimony and thallium from two clayey-silty zones (depths about 147 and 165 ft bgs) in sandstone core from the Ackley MW #1. In these two zones antimony was detected at concentrations ranging between 0.1 to 2.8 parts per million (ppm), and thallium between 0.4 and 1.7 ppm (table 6). Metal analyses were conducted on six samples taken from cores of the glacial deposits at depths between 4 and 60 ft bgs. Antimony was not detected in any of samples from glacial deposits; analyses for thallium were not performed (T. Ledder, Bad River Natural Resources Department, 2000, personal commun.). The possible relation between these analyses and elevated concentrations in ground water reported by the Bad River Tribe has not been addressed as part of this study.
[values in parts per million, except Au in parts per billion; <, less than; ft, feet; nd, non-detect; ICP, Induction Coupled Plasma-Mass Spectrometer; INAA, Instrumental Neutron Activation Analysis; ICP and INAA analysis conducted by USGS, Geology Discipline]
| Element | Detection Limit | ICP | INAA | ||
|---|---|---|---|---|---|
| 146.90 ft | 164.65 ft | 146.90 ft | 164.65 ft | ||
| Ag | 2 | < 2 | < 2 | 0.15 | 0.35 |
| Al | 8 | 27800 | 109,000 | nd | nd |
| As | 2 | < 2 | 12.1 | .83 | 10.6 |
| Au | nd | nd | .41 | .47 | |
| Ba | 0.5 | 525 | 822 | 595 | 934 |
| Be | .001 | 0.56 | 11.5 | nd | nd |
| Bi | .005 | < .005 | .43 | nd | nd |
| Br | nd | nd | .44 | .22 | |
| Ca | 20 | 169 | 1,300 | 149 | 1,760 |
| Cd | .003 | .02 | .12 | .65 | < .10 |
| Ce | .5 | 6.7 | 70.1 | 6.7 | 72.7 |
| Co | .1 | .4 | 20.6 | .33 | 18.6 |
| Cr | .2 | 2.6 | 65.4 | 2.5 | 72.6 |
| Cs | .003 | .62 | 16.6 | 0.68 | 17.3 |
| Cu | .5 | < .5 | 35.4 | nd | nd |
| Eu | .005 | .25 | 1.26 | .21 | 1.26 |
| Fe | 50 | 1,880 | 81,600 | 2100 | 92,300 |
| Ga | .006 | 5.4 | 58.4 | nd | nd |
| Gd | nd | nd | .62 | 6.96 | |
| Ho | .02 | .21 | 2.0 | .17 | 1.61 |
| Hf | nd | nd | 2.78 | 18.2 | |
| Hg | nd | nd | < .1 | .3 | |
| K | 20 | 24,800 | 50,200 | 24,900 | 47,000 |
| La | .3 | 5.2 | 51.8 | 4.91 | 54.6 |
| Li | .2 | 1.4 | 29.6 | nd | nd |
| Lu | nd | nd | .089 | .921 | |
| Mg | .3 | 106 | 7,170 | nd | nd |
| Mn | .2 | 25.7 | 528 | nd | nd |
| Mo | .1 | .30 | 1.1 | < .3 | 1.14 |
| Na | 6 | 793 | 831 | 916 | 1,020 |
| Nb | 2 | < 2 | 36 | nd | nd |
| Nd | .2 | 3.2 | 37.6 | 3.38 | 36.2 |
| Ni | 1 | 1.9 | 39.8 | 4.7 | 38.2 |
| P | 8 | 18.9 | 195 | nd | nd |
| Pb | .2 | 9.5 | 27.1 | nd | nd |
| Rb | .01 | 76.2 | 301 | 73.4 | 278 |
| Sb | .02 | .1 | 2.8 | .12 | 2.59 |
| Se | nd | nd | .082 | .87 | |
| Sc | .3 | .8 | 21.7 | .577 | 22.9 |
| Sm | nd | nd | .654 | 6.5 | |
| Sr | .05 | 50.4 | 121 | 56 | 114 |
| Ta | .2 | < .2 | 4.1 | .13 | 2.81 |
| Tb | nd | nd | .099 | .95 | |
| Th | .03 | 1.52 | 30.8 | 1.5 | 30.7 |
| Ti | 40 | 210 | 12,800 | nd | nd |
| Tl | .003 | .36 | 1.66 | <100 | <100 |
| Tm | nd | nd | .084 | .832 | |
| U | .02 | .55 | 9.02 | .56 | 9.2 |
| V | .4 | 1.9 | 105 | nd | nd |
| W | nd | nd | .079 | 3.77 | |
| Y | .3 | 4.2 | 39.4 | nd | nd |
| Yb | .03 | .76 | 7.8 | .55 | 5.57 |
| Zn | 5 | < 5 | 168 | 5.9 | 150 |
| Zr | nd | nd | 94.3 | 669. | |
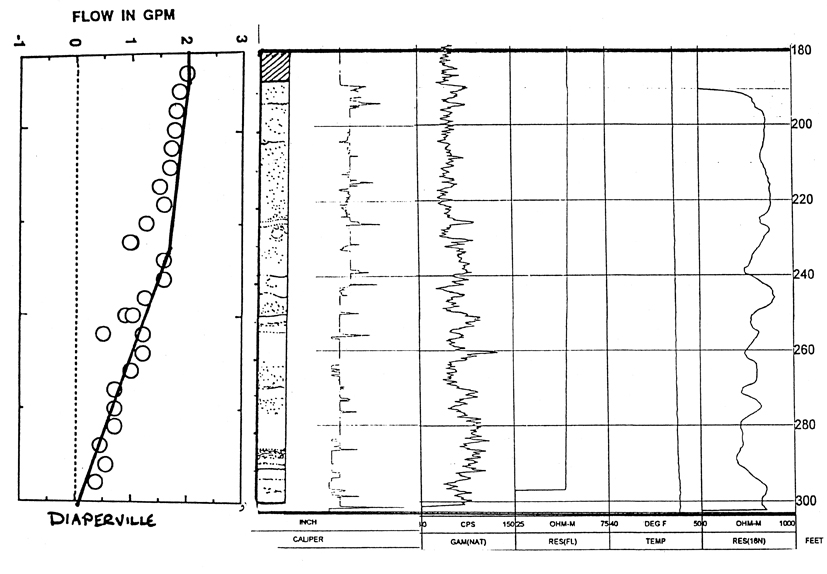
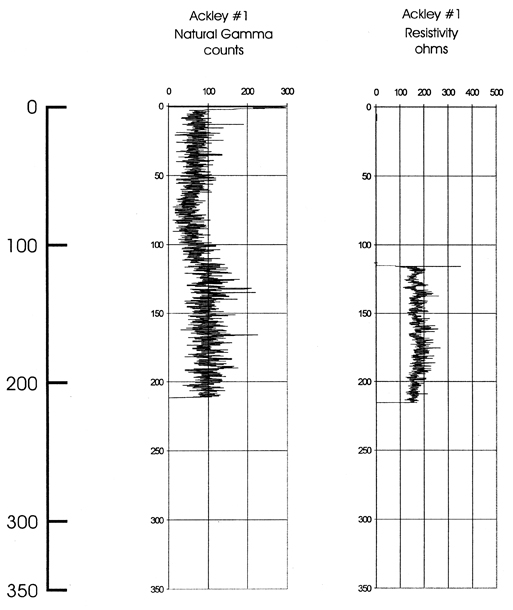
Natural gamma logs (Appendix C) identified the transition from the glacial deposits to the sandstone. The higher natural gamma ray counts usually associated with finer-grained sediments is apparent in all three wells, but the change to lower gamma ray counts in the sandstone is not abrupt. Rather, the natural gamma seems to show a transition to lower natural gamma ray counts in the coarse unconsolidated glacial and reworked bedrock material that is believed to be overlying the competent bedrock.
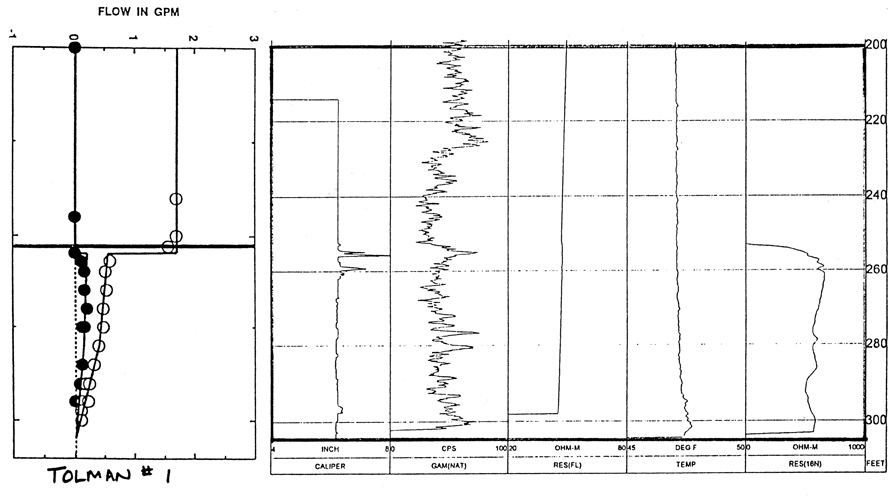
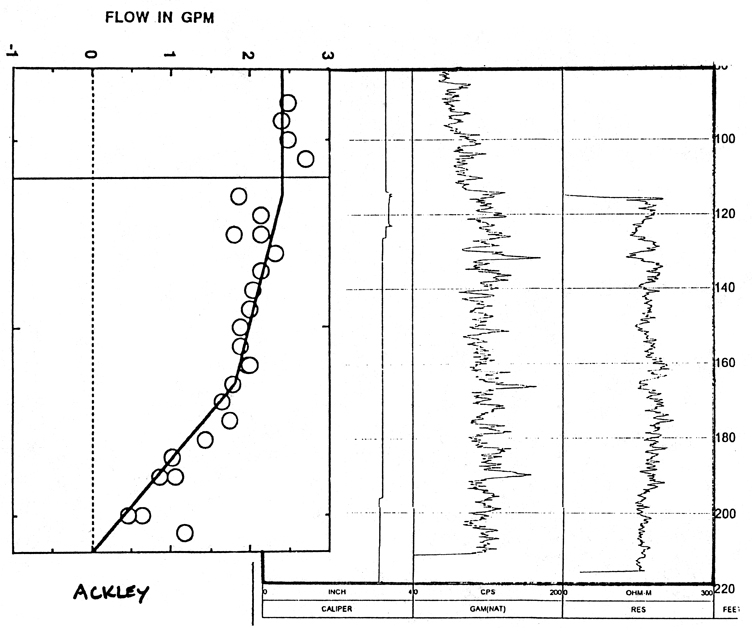
With no pumping, the flow profiles generated by the heat-pulse flow meter indicated little or no vertical flow in each of the monitoring wells. (Appendix C). Of the three, the Tolman MW #1 did show some secondary permeability, with upward flow from the underlying sandstone flowing into what is probably a bedding plane just below the bottom of casing. Flow profiles generated during pumping indicate that flow production in Diaperville MW #1 and Ackley MW #1 is distributed throughout much of the open section (Fred Paillet, U.S. Geological Survey, 1999, written commun.).
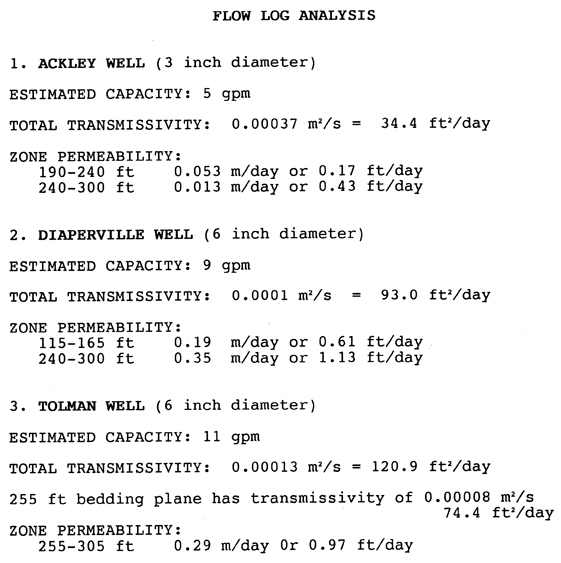
Horizontal hydraulic conductivity (Kh) for each subzone estimated using transmissivity values (determined from heat-pulse flow-meter analysis and interval thickness) show that the Kh of the sandstone generally increases towards the bottom of each borehole. Kh values range from about 0.2 ft/day to more than 1.0 ft/day (Fred Paillet, U.S. Geological Survey, 1999, written commun.), typical of moderately well-cemented sandstone (Appendix C).
The Diaperville aquifer test lasted 24 hours and induced drawdown in the observation well completed in the sandstone and the two observation wells completed in the unconsolidated glacial deposits (figs. 8 and 9). The observed drawdowns were complicated by periodic pumping of the two Diaperville CWs (#1 and #2) and occasional pumping of the Big Boy well. This pumping activity is apparent on the plot of drawdown and time (figs. 8 and 9). As would be expected, the drawdown in the Diaperville CW #2 (the bedrock observation well) was greater when it was pumping, as contrasted to when the Diaperville CW #1 was pumping 80 ft away. Because of the periodic pumping in these wells, drawdown data used in analysis were selectively chosen in some instances to avoid measured depths that were affected by pumping. Even so, the portions of the drawdown record that appear to be the least affected have still been compromised with respect to the aquifer test due to the volume of water removed by the periodic pumping of these wells. This could not be avoided, and the result is that analytical solutions underestimate aquifer transmissivity slightly.
At the steady pumping rate of 50 gal/min for 24 hours, a volume of approximately 72,000 gallons was removed from the aquifer. Most of this volume came from the sandstone aquifer, but drawdown in the two shallower wells indicates that water is also coming from the glacial deposits. At the end of 24 hours, drawdown in the pumped well was about 75 ft, drawdown in the Diaperville Community Well #2 was 3.51 ft, drawdown in the Hand Pump well was 1.11 ft and drawdown in the Big Boy well was 1.08 ft (figs. 8 and 9). The pumping rate (50 gal/min) divided by the drawdown (75 ft) gives the specific capacity of the Diaperville MW #1, calculated to be 0.67 [(gal/min)/ft].
Values for T, Kh, and S in the sandstone aquifer were calculated for the time-drawdown observed in the Diaperville Community Well #2. Analysis by charts and computer programs provided very similar results; the value of T ranges from 479 to 509 ft2 per day, the value of S ranges from 0.00019 to 0.00033, and the value of Kh ranges from 4.2 to 4.5 ft per day (table 7). The calculated Kh is based on the assumption that the 114 ft open interval of the Diaperville MW #1 is fully penetrating the aquifer. Kh estimates from heat-pulse flow-meter data are lower, suggesting that the saturated thickness of the aquifer is greater than 114 ft.
[ft, feet; ft2, square feet]
| Transmissivity (in ft2/day) | Storativity | r/B | Hydraulic conductivity (in ft/day) | |
|---|---|---|---|---|
| Analysis using chart overlays | 479 | 0.00033 | 0.40 | 4.2 |
| Analysis using Aqtesolv | 509 | 0.00019 | 0.42 | 4.5 |
Static water-level altitudes (unaffected by recent pumping of either private or community wells) were measured in the four monitored wells to be within 0.31 ft of each other (table 8). This suggests that the vertical gradient between wells completed in the bedrock and wells completed in the glacial deposits is small. This is supported by the interpretation of the heat-pulse flow-meter log which suggests there is no ambient vertical flow in the open-hole portion of the Diaperville MW #1. Considering water-altitude data from the two wells unaffected by periodic pumping—Diaperville MW #1 and the hand-pumped well—a small downward gradient exists between the sandstone and glacial aquifers.
[ft, feet; NGVD 29, National Geodetic Vertical Datum of 1929]
| Water level altitudes (in ft above NGVD 29) | |
|---|---|
| Diaperville MW #1 | 609.75 |
| Diaperville #2 | 609.75 |
| Big Boy | 610.06 |
| Hand Pump | 609.98 |
| Tolman MW #1 | 613.70 |
| DeGodt | 613.78 |
The Tolman aquifer test lasted 21 hours and 3 minutes, and induced drawdown in the DeGodt well completed in the sandstone (fig. 10). The planned 24-hour test ended early due to an electrical supply problem. At the steady pumping rate of 30 gal/min for this duration, a volume of approximately 37,890 gallons was removed from the aquifer. At the end of the test, drawdown in the Tolman MW #1 was 135.54 ft, and drawdown in the sandstone DeGodt well was 7.07 ft. The specific capacity of the Tolman MW #1 is calculated to be 0.22 gal/min per foot.
Figure 10. Time-drawdown plot of the Tolman Monitoring Well #1 aquifer test, Ashland County, Wis.
Values for T, Kh, and S in the sandstone aquifer were calculated for the time-drawdown observed in the DeGodt well. The calculated values for T, S, and Kh using either method (charts or computer) are very similar: the value of T ranges from 83 to 114 ft2 per day, the value of S ranges from 0.00041 to 0.00046, and the values of Kh range from 1.6 to 2.7 ft per day (table 9). The calculated Kh is based on the assumption that the 53 ft open interval of the Tolman MW #1 is fully penetrating the aquifer. Kh estimates from heat-pulse flow-meter data are lower, suggesting that the saturated thickness of the aquifer is greater than 53 ft.
[ft, feet; ft 2, square feet]
| Transmissivity (in ft2/day) | Storativity | r/B | Hydraulic conductivity (in ft/day) | |
|---|---|---|---|---|
| Analysis using chart overlays | 144 | 0.00046 | 0.30 | 2.7 |
| Analysis using Aqtesolv | 83 | 0.00041 | 0.70 | 1.6 |
Static water levels in the two monitored wells had a measured difference of 0.03 ft prior to the beginning of the aquifer test (table 8).
Based on the aquifer tests performed at the Diaperville MW #1 and Tolman MW #1 sites, hydraulic parameter values have been estimated for the sandstone aquifer (table 10).
[ft, feet; ft2, square feet; [(gal/min)/foot], gallons per minute per foot]
| Transmissivity (ft2/day) | 83 – 509 |
| Hydraulic conductivity (ft/day) | 1.6 – 4.5 |
| Storativity | 0.00019 – 0.00046 |
| Specific capacity [(gal/min)/foot] | 0.22 – 0.67 |
Volatile organic compounds were not detected in water samples from the Diaperville MW #1 or the Ackley MW #1 (Appendix D). The major inorganic ions in water sampled from the Ackley MW #1 (table 11) indicate the water is of the calcium-magnesium-sodium-bicarbonate type (David Hall, U.S. Geological Survey, 2003, personal commun.).
[µS/cm, microsiemens per centimeter; mg/L, milligrams per liter; µg/L, micrograms per liter]
| Parameter | Units | Value |
|---|---|---|
| pH | standard units | 7.9 |
| Specific conductance | µS/cm | 371 |
| Calcium | mg/L | 27.8 |
| Magnesium | mg/L | 10.9 |
| Potassium | mg/L | 4.26 |
| Sodium | mg/L | 28.8 |
| Bromide | mg/L | .21 |
| Chloride | mg/L | 18.7 |
| Fluoride | mg/L | .4 |
| Silica | mg/L | 16.2 |
| Sulfate | mg/L | 28.2 |
| Iron | µg/L | 48 |
| Manganese | µg/L | 28.8 |
The Precambrian sandstone aquifer in the northwest part of the Bad River Band of Lake Superior Tribe of Chippewa Indians Reservation is a primary source of drinking water. Data were collected to determine the hydraulic properties of the sandstone aquifer, the nature of the hydraulic connection between the glacial deposits and the underlying sandstone aquifer, the importance of matrix porosity and fractures to ground-water flow, and the quality of ground water in the sandstone aquifer.
The hydrogeologic setting of the northern part of the Bad River Indian Reservation is characterized by Holocene and Pleistocene sediments overlying Middle to Late Proterozoic sandstone. A Holocene silty-sand and sand aquifer overlies massive clay of the Pleistocene Miller Creek Formation (Batten and Lidwin, 1995). The Miller Creek Formation overlies the Pleistocene Copper Falls Formation, which contains an increasing proportion of sand and gravel in its lower portion. The Copper Falls Formation directly overlies the sandstone aquifer.
In cooperation with the Bad River Tribe, three new monitoring wells were drilled during May of 1998. Two wells, the Diaperville MW #1 and Tolman MW #1, were completed open hole in the sandstone with the glacial deposits behind casing. During July of 1998, the sandstone in the third monitoring well, the Ackley MW #1, was cored from its casing point of 113.5 ft bgs to a total depth of 217.0 ft bgs. The three monitoring wells were geophysically logged during August of 1998 by the USGS. Some combination of caliper, natural gamma, formation resistivity, fluid resistivity, flow, and temperature logs was run in all three wells. The natural gamma logs show a transition from the higher natural gamma ray counts in the Miller Creek Formation to lower counts in the coarse, unconsolidated, glacial and reworked-bedrock material of the Copper Falls Formation that is believed to be overlying the competent bedrock. Flow profiles generated by the heat-pulse flow meter indicated little or no vertical flow in the Diaperville MW #1 or Ackley MW #1. The Tolman MW #1 did show some secondary permeability, with flow from the underlying sandstone coming up and out into what is probably a bedding plane just below the bottom of casing.
The three monitoring wells have likely encountered two stratigraphically different sandstone units. The sandstone core from the Ackley MW #1 was evaluated in thin section by Dr. Richard Ojakangas of the University of Minnesota–Duluth and interpreted to be Chequamegon Sandstone of the Late Proterozoic Bayfield group. This is consistent with Batten and Lidwin's (1995) suggestion of the presence of the Bayfield Group sandstones in the northwestern part of the Reservation. By contrast, the description by Batten and Lidwin (1995) suggest that sandstones encountered by the Diaperville MW #1 and Tolman MW #1 would be older Middle Proterozoic Oronto Group.
From analysis of sandstone core samples at depths 146.90 and 164.65 ft in the Ackley MW #1, antimony is detected at concentrations ranging between 0.1 to 2.8 ppm, and thallium is detected at concentrations ranging between 0.4 and 1.7 ppm. The possible relation between these concentrations and elevated concentrations found in ground water on the Reservation (T. Ledder, Bad River Natural Resources Department, 2000, personal commun.) has not been addressed as part of this study. Additional analyses for antimony were conducted by the Bad River Natural Resources Department on six samples taken of the glacial deposits from the Ackley site at depths between 4 and 60 ft. Antimony was not detected in any samples.
Evaluation of the aquifer tests in the Diaperville MW #1 and the Ackley MW #1 provide the following range of values for hydraulic properties of the sandstone aquifer:
| Transmissivity | 83 – 509 ft2/day |
| Hydraulic conductivity | 1.6 – 4.5 ft/day |
| Storativity | 0.00019 – 0.00046 |
| Specific capacity | 0.22 – 0.67 gallons per minute per foot |
The aquifer test at Diaperville MW #1 resulted in drawdown in glacial wells, showing the presence of a hydraulic connection between the sandstone and coarse intervals within the lower portions of the overlying glacial deposits. Though high- and low-angle fractures are present in core, the hydraulic properties of the bedrock aquifer appear to be due largely to the matrix porosity (16–21 percent) and permeability of the sandstone. Major ion analyses indicate that the water sampled from the sandstone aquifer at the Ackley site is of the calcium-magnesium-sodium-bicarbonate type. Volatile organic constituents were not detected in water samples from the Diaperville MW #1 or the Ackley MW #1.
Batten, W.G. and Lidwin, R.A., 1995, Water resources of the Bad River Indian Reservation, northern Wisconsin: U.S. Geological Survey Water-Resources Investigations Report 95–4207, 45 p.
Clayton, Lee, 1984, Pleistocene geology of the Superior Region, Wisconsin: University of Wisconsin-Extension Geological and Natural History Survey, Information Circular Number 46, 40 p.
Geraghty and Miller, Inc., 1991, AQTESOLV, version 1.1
Hantush, M.S., 1960, Modification of the theory of leaky aquifers, Journal of Geophysical Research, v. 65, no. 11, p. 3713–3726.
Hantush, M.S., and Jacobs, C.E., 1955, Nonsteady radial flow in an infinite leaky aquifer, Transactions, American Geophysical Union, vol. 36, no.1, p. 95–100.
Keys, W.S., 1990, Borehole geophysics applied to ground-water investigations: Techniques of Water-Resources Investigations of the U.S. Geological Survey, Book 2, Chapter E2, 150 p.
Mudrey, M.G., Jr., Brown, B.A., and Greenberg, J.K., 1982, Bedrock geologic map of Wisconsin: University of Wisconsin-Extension Geological and Natural History Survey, scale 1:1,000,000, 1 sheet.
Stallman, R.W., 1971, Aquifer-test design, observation, and data analysis: Techniques of Water-Resources Investigations of the U.S. Geological Survey, Book 3, Chapter B1, 31 p.
Theis, C.V., 1935, The relation between the lowering of the piezometric surface and the rate and duration of discharge of a well using ground-water storage, Transactions, American Geophysical Union, vol. 16, p. 519–524.
Appendix A. Well construction records.
Appendix B. Results of thin-section and porosity analysis.
[Values are percentages; QFL includes all types of quartz; Qm F Lt includes only monocrystalline (common) quartz; polycrystalline and chert are rock fragments.]
| Sample | A | B | C | D | E | Ave | |
|---|---|---|---|---|---|---|---|
| Depth below ground surface | 117–188 ft | 137–138 ft | 162–163 ft | 175–176 ft | 216 ft | ||
| Quartz | Common | 57.3 | 63.0 | 50.3 | 52.0 | 54.3 | 55.4 |
| Polycrystalline | 0.3 | 2.0 | 1.3 | 0.3 | 4.0 | 1.6 | |
| Chert | 0 | 0.7 | Trace | ||||
| K-Feldspar | (Stained) | 18.3 | 14.0 | 20.7 | 17.0 | 10.0 | 16.0 |
| Rock Fragments | Felsic Volcanic | 0.3 | 0.3 | 0.7 | 0.3 | 0.7 | 0.5 |
| Miscellaneous | Toumaline | 0.3 | Trace | ||||
| Leucoxene | 0.3 | Trace | |||||
| Cement | Silica | 7.0 | 4.7 | 8.0 | 8.7 | 9.0 | 7.5 |
| Clay | 0.3 | 0.7 | 2.7 | 1.7 | 1.3 | 1.3 | |
| Pore spaces | 16.0 | 17.7 | 16.3 | 20.0 | 20.7 | 18.1 | |
| QFL | 75.5/24.0/0.4 | 85.7/13.9/0.4 | 70.8/28.3/1.0 | 75.1/24.4/0.5 | 84.5/84.5/1.0 | 78.3/21.0/?? | |
| Qm F Lt | 75.1/24.0/0.9 | 82.2/13.9/3.9 | 68.9/28.3/2.7 | 74.6/24.4/1.0 | 78.7/14.5/6.8 | 75.9/21.0/2.9 | |
| Rock Name | Feldspathic Sandstone | Feldspathic Sandstone | Arkose Sandstone | Feldspathic Sandstone | Feldspathic Sandstone |
Appendix C. Geophysical logs—Caliper log and electric logs from the Diaperville Monitoring Well #1.
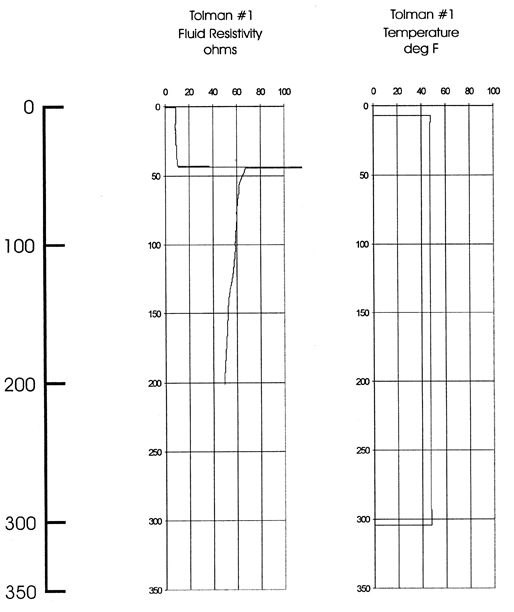
Appendix C. Geophysical logs—Caliper log and electric logs from the Tolman Monitoring Well #1.
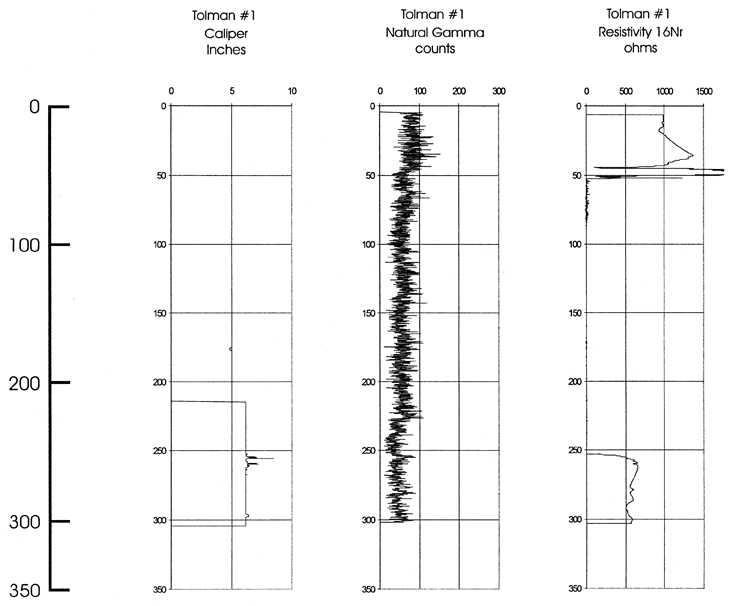
Appendix C. Geophysical logs—Electric logs from the Tolman Monitoring Well #1.
Appendix C. Geophysical logs—Electric logs from the Ackley Monitoring Well #1.
| AccessibilityFOIAPrivacyPolicies and Notices | |
 |
|