 |
|
|
||||
| Open-File Report 2004–1431 |
Version 1.2
2004
Open-File Reports are used for the dissemination of information that must be released immediately to fill a public need or for information that is not sufficiently refined to warrant formal publication. As such, Open-File Reports should not be viewed as final reports of major scientific investigations. Because of their preliminary nature and possibility of being superseded, Open-File Reports do not introduce new or revised geologic, stratigraphic, hydrologic, or taxonomic nomenclature. In particular, Article 4(a) of the North American Stratigraphic Code excludes open-file releases for the naming or revising of formal geologic units. Any use of trade, firm, or product names is for descriptive purposes only and does not imply endorsement by the U.S. Government.
U.S. DEPARTMENT OF THE INTERIOR
U.S. GEOLOGICAL SURVEY
1barnabyr@usgs.gov, Denver, Colorado
Analysis of Airborne Visible/Infrared Imaging Spectrometer (AVIRIS) data covering the Big Rock Candy Mountain area of the Marysvale volcanic field, west-central Utah, identified abundant rocks and soils bearing jarosite, goethite, and chlorite associated with volcanic rocks altered to propylitic grade during the Miocene (23—21 Ma). Propylitically-altered rocks rich in pyrite associated with the relict feeder zones of convecting, shallow hydrothermal systems are currently undergoing supergene oxidation to natrojarosite, kaolinite, and gypsum. Goethite coatings are forming at the expense of jarosite where most pyrite has been consumed through oxidation in alluvium derived from pyrite-bearing zones. Spectral variations in the goethite-bearing rocks that resemble variations found in reference library samples of goethites of varying grain size were observed in the AVIRIS data. Rocks outside of the feeder zones have relatively low pyrite content and are characterized by chlorite, epidote, and calcite, with local copper-bearing quartz-calcite veins. Iron-bearing minerals in these rocks are weathering directly to goethite.
Laboratory spectral analyses were applied to samples of iron-bearing rock outcrops and alluvium collected from the area to determine the accuracy of the AVIRIS-based mineral identification. The accuracy of the iron mineral identification results obtained by analysis of the AVIRIS data was confirmed. In general, the AVIRIS analysis results were accurate in identifying medium-grained goethite, coarse-grained goethite, medium- to coarse-grained goethite with trace jarosite, and mixtures of goethite and jarosite. However, rock fragments from alluvial areas identified as thin coatings of goethite with the AVIRIS data were found to consist mainly of medium- to coarse-grained goethite based on spectral characteristics in the visible and near-infrared.
To determine if goethite abundance contributed to the spectral variations observed in goethite-bearing rocks with AVIRIS data, a laboratory experiment was performed in which spectra were acquired of a goethite-bearing rock while progressively decreasing the areal abundance of the rock with respect to a background of white, fine-grained quartz sand. This experiment found that, with decreasing material abundance, the crystal field absorption feature of goethite near 1.0 micron decreases in depth and narrows more from the long wavelength side of the feature than from the short wavelength side, as is the case in goethite reference spectra as grain size decreases from coarse to fine.
In the Marysvale study area, goethite-bearing alluvium downgradient from source outcrops tends to be identified as finer-grained or thin coatings of goethite due to the mineral's presence in lesser abundance. The goethite-bearing alluvium is a closer match to reference spectra of thin coatings of goethite even though the actual grain size of the contained goethite fragments is medium to coarse grained, the same on average as that from the source outcrops. Coarser-grained goethite most likely will be correctly identified in areas of greater goethite abundance proximal to jarosite-bearing source rock where the surface is relatively free of goethite-free soil components and vegetation that corrupt the goethite spectral response.
When analysis of imaging spectroscopy data is performed using reference spectra of iron minerals of varying grain sizes and mixed compositions, the results are useful not only for purposes of mineral identification, but also for distinguishing goethite-bearing outcrop from alluvial surfaces with similar mineralogy, providing valuable information for geologic, geomorphologic, mineral exploration, and environmental assessment studies.
Iron oxides, hydroxides, oxyhydroxides, and sulfates are common on the earth's surface and are associated with hydrothermally altered rocks and other weathered iron-bearing rocks. The character and surficial distribution of iron-bearing minerals often provide important keys for locating and understanding the nature of hydrothermally altered rocks and their associated mineral deposits. In addition, secondary iron-bearing minerals are important indicators of areas with possible acid producing potential (APP). The presence of jarosite, a relatively insoluble iron sulfate mineral that can be produced through supergene, subaerial weathering of pyrite and other iron-bearing sulfide minerals and is readily identifiable using spectroscopic remote sensing, has been used as an important indicator of sources of acid generation in mine waste and mineralized rocks in unmined areas (Swayze and others, 2000; Rockwell and others, 2005). Soluble sulfate salts precipitated from low pH waters associated with pyrite oxidation, including the hydrated ferric iron hydroxyl-sulfate mineral copiapite, the hydrated ferrous iron sulfate melanterite, and ferric and ferrous iron-bearing hydroxyl-sulfates such as schwertmannite, also are characterized by diagnostic electronic absorption features in the visible and near-infrared (NIR) that allow spectroscopic identification and differentiation (Crowley and others, 2003; Cunningham and others, 2004). These minerals are difficult to remotely identify using imaging spectroscopy, however, because of their limited areal occurrence with respect to the often genetically related hematite, goethite, and(or) jarosite that are more common and stable and tend to dominate the spectral signature of a remotely-sensed image pixel. Iron hydroxides, such as goethite, are abundant on the earth's surface and are commonly associated with more neutral surface hydrological conditions in zones of hydrothermally altered rocks and mine waste and tailings. Rocks and soils associated with iron sulfate and hydroxide minerals in these environments often have anomalously high concentrations of toxic metals available for release into ground- and surface-water systems. Potentially toxic metals, such as arsenic, may preferentially adsorb to poorly crystalline (amorphous) iron hydroxides and oxyhydroxides in near neutral pH environments (Bowell, 1994). Spectroscopy is an accurate and efficient tool for locating and identifying iron-bearing minerals, especially considering that X-ray diffraction (XRD) generally is unreliable in detecting amorphous iron minerals even when iron is present in high abundance (Swayze and others, 2000; Rockwell and others, 2005).
Where pyrite occurs in altered rocks or in piles of mine waste, subaerial oxidation generates copiapite and(or) melanterite, which eventually will dehydrate to the more stable and insoluble jarosite. As the pyrite is consumed through oxidation, local acidity will decrease, and coatings of goethite will be formed, gradually replacing and covering the coatings of jarosite. Therefore, a gradational outward transition from a central zone of pyrite to minerals formed in progressively more neutral pH conditions will develop (Swayze and others, 2000). Due to its low reflectance, weak (saturated) crystal field absorptions, and frequent masking by coatings of secondary iron sulfate minerals, pyrite itself often is difficult to remotely identify using imaging spectroscopy, although the mineral was directly detected using data acquired by the Airborne Visible Infrared Imaging Spectrometer (AVIRIS) at an abandoned sulfide ore mill near Stockton, Utah (Rockwell and others, 2005). With imaging spectroscopy, the mineralogic signature of ongoing pyrite oxidation usually is observed as a central zone of fine-grained jarosite, which grades outwards to a jarosite + goethite areal mix, and finally to goethite. Additional zonation within the zone of goethite-bearing rocks also has been observed surrounding unmined and anthropogenic sources of pyrite in semiarid climates (Rockwell and others, 2005; Livo and Clark, 2002). The purposes of this report are to document and to explain these spectral variations observed using AVIRIS data and to verify the iron mineral identification results obtained from AVIRIS data through the use of an expert system for semiautomated spectroscopic analysis.
An expert system for spectral analysis developed at the United States Geological Survey (USGS) (Clark and others, 2003a) compares an "unknown" input spectrum from a laboratory or imaging spectrometer to a subset of spectra derived from a large spectral library of minerals, mineral mixtures, man-made materials, volatiles, and vegetation (Clark and others, 2003b). A modified least-squares curve-fitting algorithm is used to perform the spectral comparisons. The basic principle behind the expert system is that the spectral library upon which the system is based represents close to the full range of spectral variability present on the earth's surface. As iron-bearing minerals exhibit profound spectral variations related to particle grain size, grain size series of several iron minerals were included in the expert system. Previous studies have shown that the distance (or path length) a photon may travel within a mineral grain increases with effective grain size, as larger grains offer increased volume-to-surface ratios and reduced chances for surface reflection (Clark, 1999). Therefore, in the visible and NIR, as grain size increases, path length and absorption increase while reflectance level decreases. Figure 1 shows spectra of a hematite grain-size series and illustrates how larger grain sizes exhibit increased saturation of the crystal field (Laporte-forbidden transition) absorption feature at 0.9 µm, indicated by the broadening of the feature and shifting of the apparent reflectance minima to longer wavelengths. In order to compare absorption features by their wavelength position and shape, the features must be isolated from other effects, such as level changes and slopes due to other absorbing (or emitting) materials (Clark and others, 2003a). A convex hull that fits the "highpoints" of a spectrum often represents these effects. A process named continuum-removal removes these extraneous effects by 1) computing a slope between two endpoints surrounding an absorption feature, and 2) removing this slope by dividing it into the original spectrum. The result of the continuum-removal procedure is a spectrum with reflectance values of 1 where the original spectrum coincides with the convex hull that fits the original spectrum.
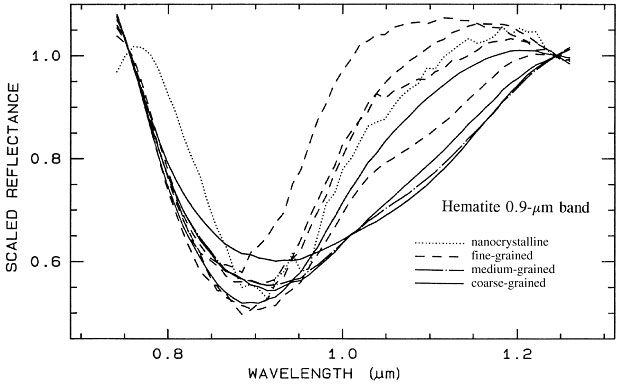 |
Figure 1. Hematite grain-size series. All spectra are in continuum-removed format. Larger grain sizes show increased saturation of the crystal field absorption at 0.9 µm, as well as broadening and shifting of the apparent reflectance minima to longer wavelengths. These spectra are included as reference spectra in the USGS expert system for spectral analysis. From Clark (1999). |
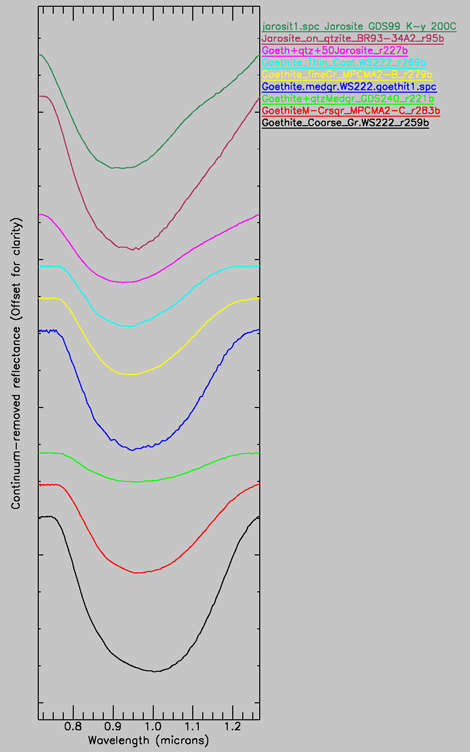
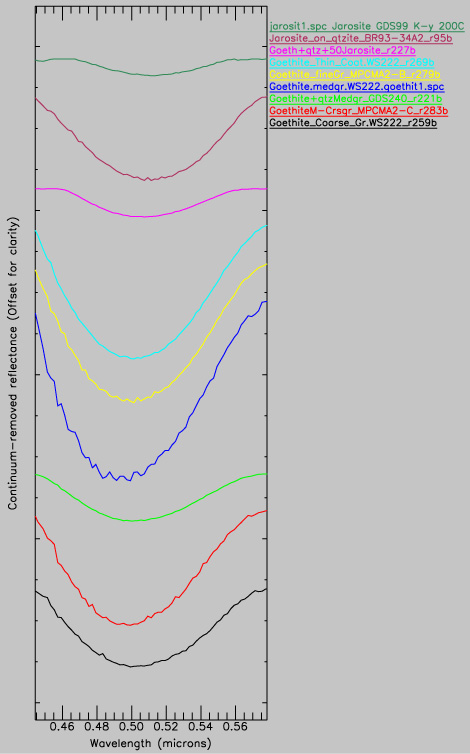
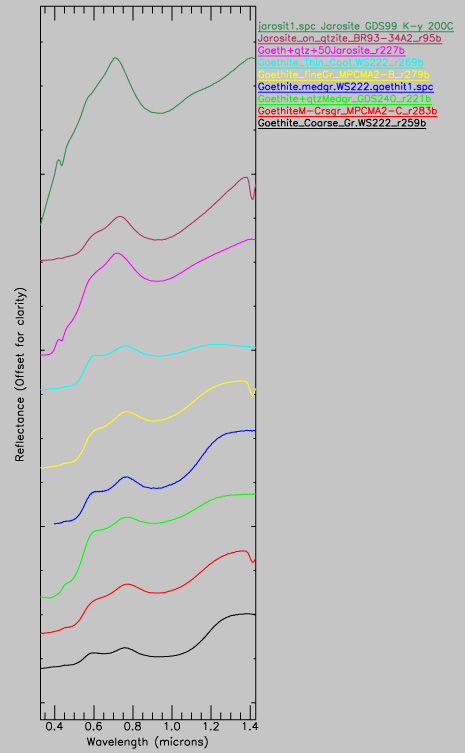
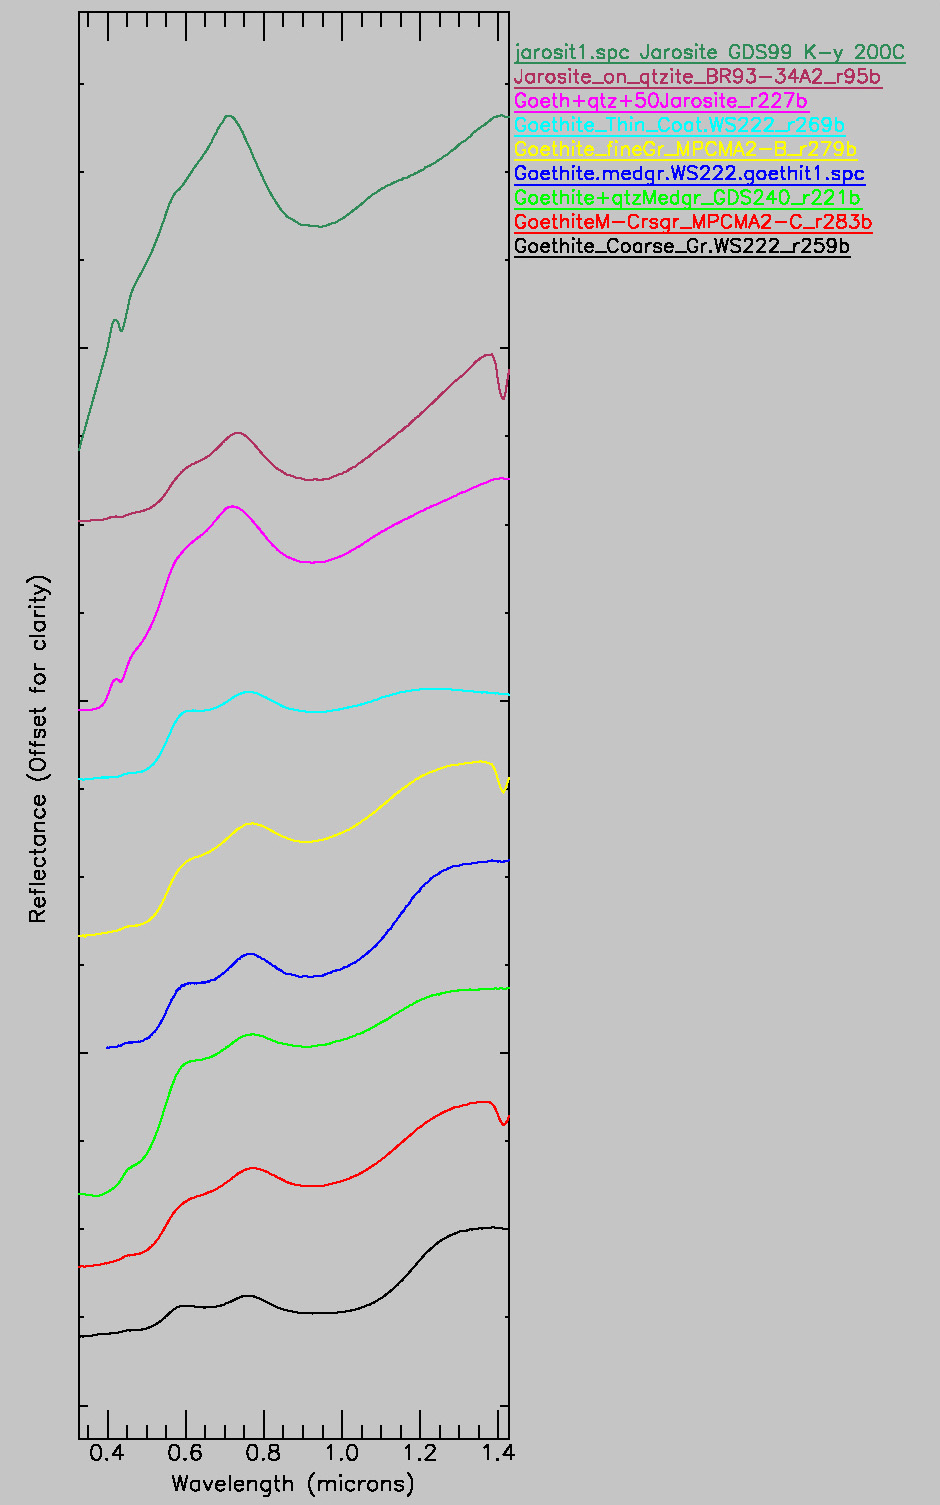
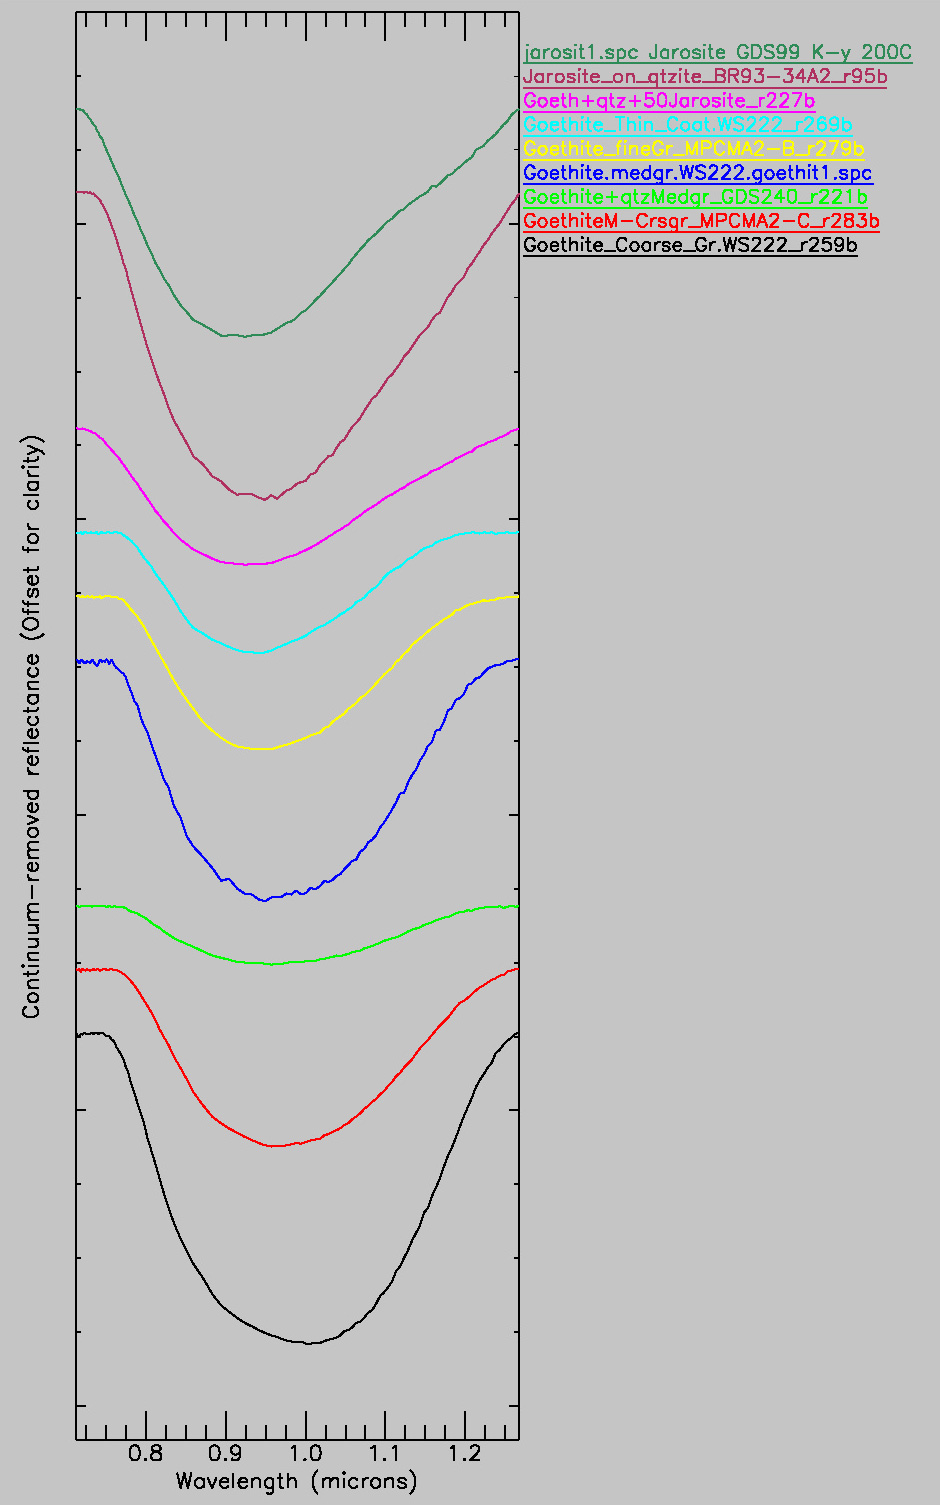
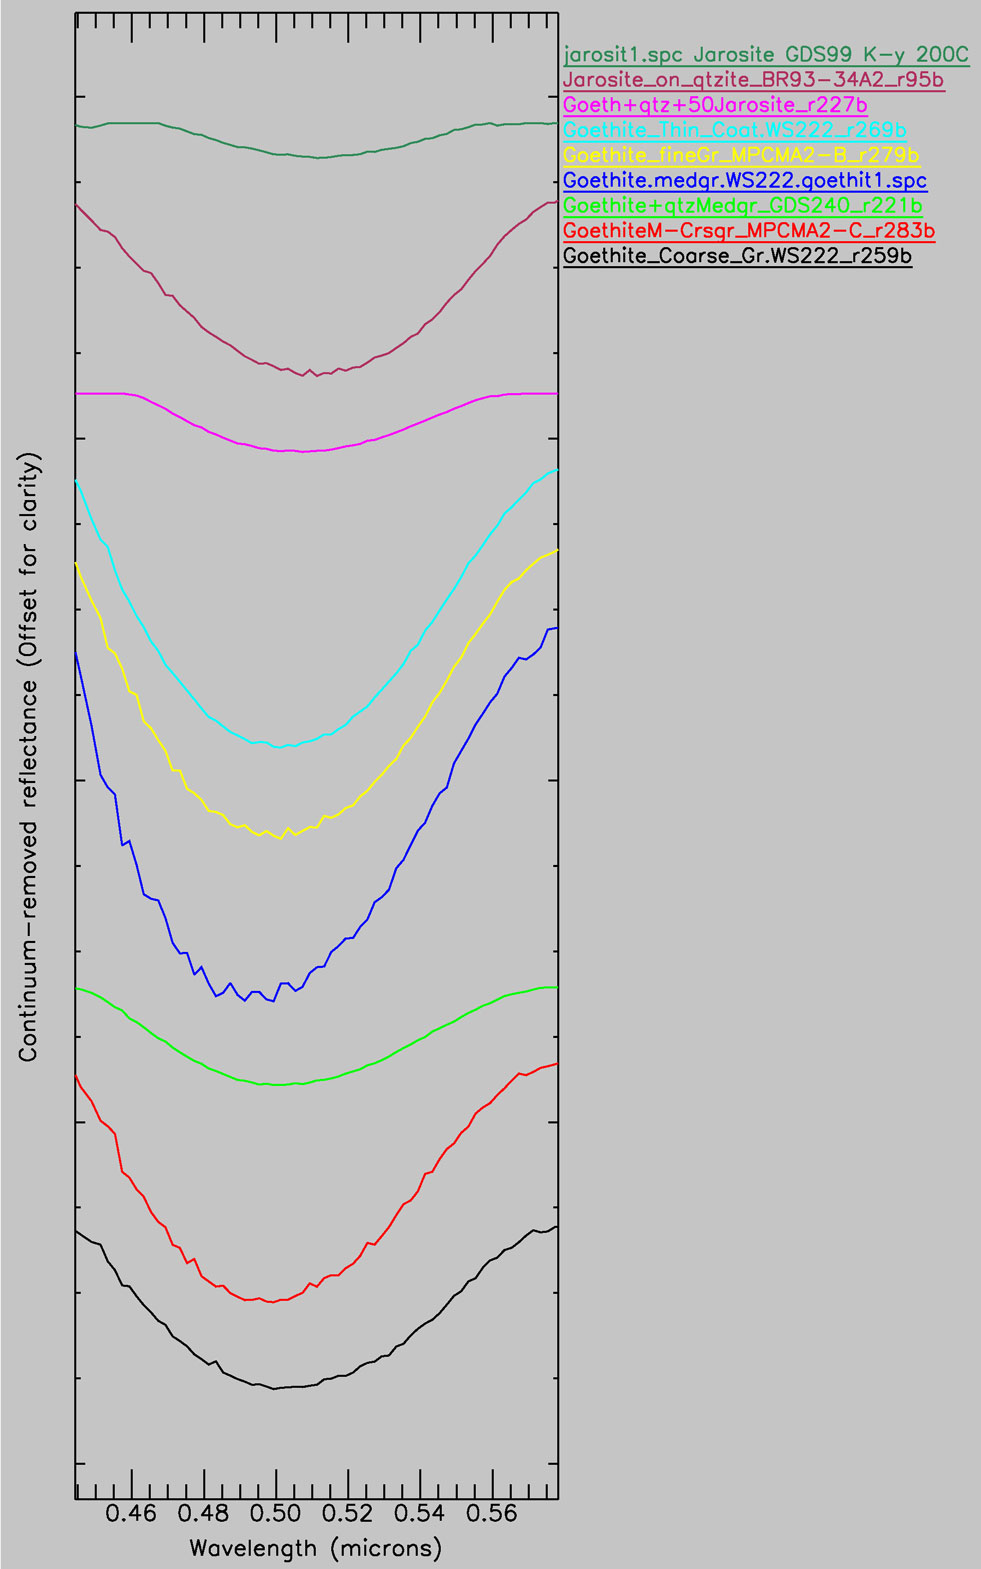
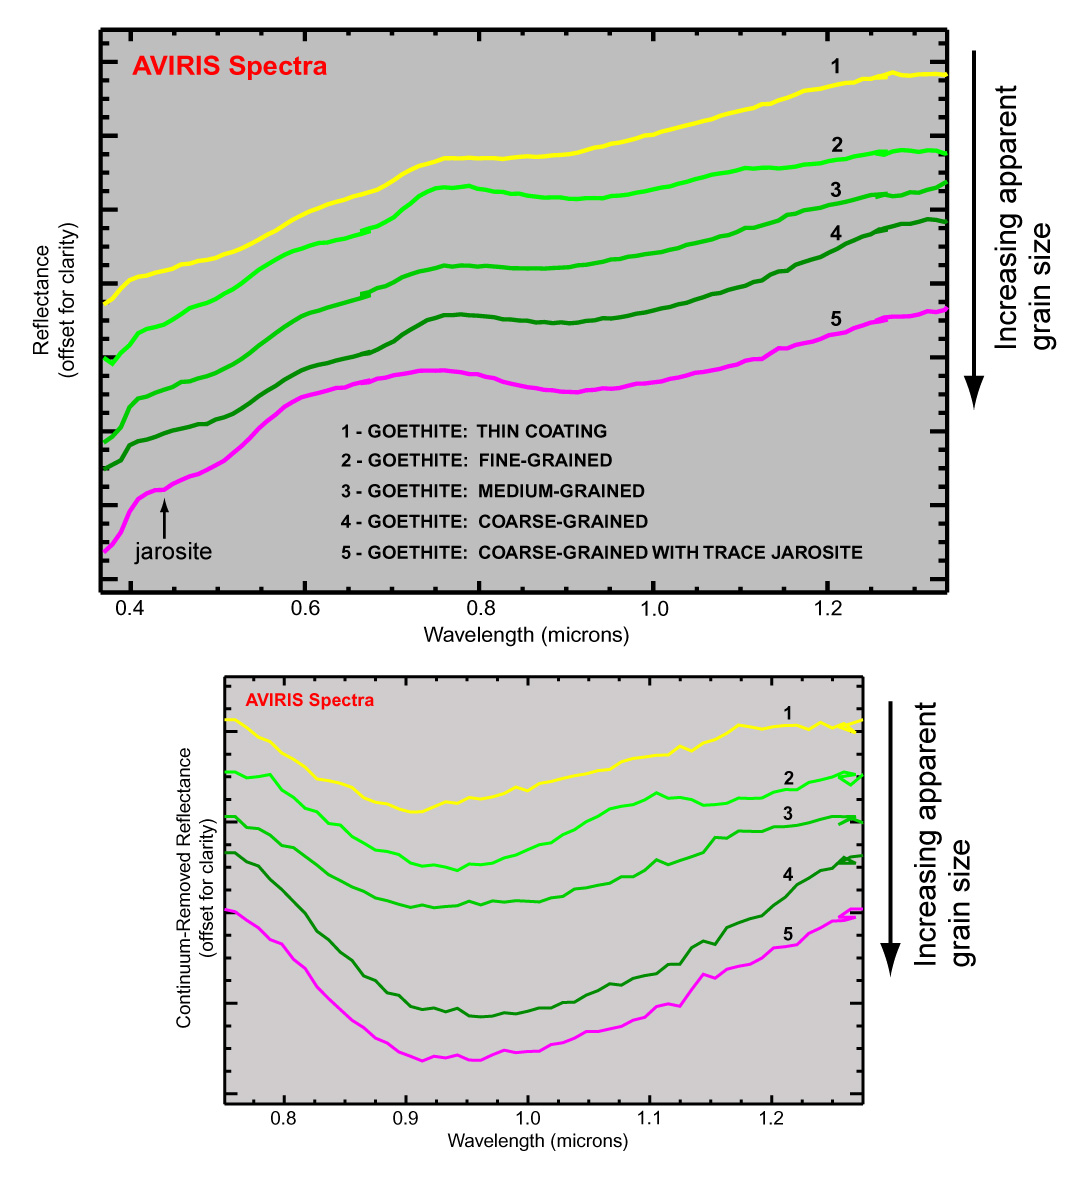
A series of goethite spectra exhibiting similar spectral variations were added to the expert system and labeled as a goethite grain-size series (Clark and others, 2003a). Some of these goethite spectra were produced from crushed, purified, and sieved botyroidal goethite, and others were included in the grain-size series based on a visual estimation of grain size according to the shape and position of the crystal field absorptions at 0.485, 0.66, and 0.9 µm (Clark and others, 2003b). Figure 2 shows the spectra of the "virtual" goethite grain size series in addition to spectra of jarosite and a goethite + jarosite mixture from the reference spectral library. Figure 3 shows the same spectra in continuum-removed format in the vicinity of the crystal field electronic transition feature near 1.0 µm. It is evident from figure 3 that the absorption feature of goethite near 1.0 µm exhibits similar changes in shape and position with apparent grain size as does the feature in the hematite spectra shown on figure 1. This feature is used as a diagnostic feature for the identification of goethite, jarosite, and hematite by the expert system. Figure 4 shows the same goethite and jarosite spectra in continuum-removed format in the vicinity of the crystal field electronic transition feature near 0.5 µm that is also used as a diagnostic feature by the expert system for the goethite series, goethite + jarosite mixture, and "coarse-grained" jarosite (sample BR93-34A2). The shape and position changes evident on figures 1 and 3 are not exhibited for the feature near 0.5 µm displayed on figure 4. The crystal field electronic transition feature near 0.66 µm (not shown) normally is not used as a diagnostic feature by the expert system because this feature overlaps with the feature caused by chlorophyll in green plants.
 |
Figure 2. Reference spectra of goethite, jarosite, and a goethite + jarosite mixture. The spectrum of sample MPCMA2-C (shown in red), labeled as a "medium to coarse" grained goethite, may contain a trace amount of jarosite, as indicated by a small Fe-OH vibrational feature in the shortwave-infrared (SWIR) near 2.27 µm (not shown). The VIS-NIR portion of the spectrum shown here shows little, if any, evidence of jarosite, which may be indicative of a goethite coating which is opaque in the VIS-NIR but partly transparent in the SWIR (Clark and others, 2003b). The figure is available for a closer view as a small or large JPG file. |
Figure 3. Reference spectra of goethite, jarosite, and a goethite + jarosite mixture. Spectra shown on figure 2 are shown here in continuum-removed format around the crystal field electronic transition feature near 1.0 µm. The figure is available for a closer view as a small or large JPG file. |
|
|
Figure 4. Reference spectra of goethite, jarosite, and a goethite + jarosite mixture. Spectra shown on figures 2 and 3 are shown here in continuum-removed format around the crystal field electronic transition feature near 0.50 µm. The figure is available for a closer view as a small or large JPG file. |
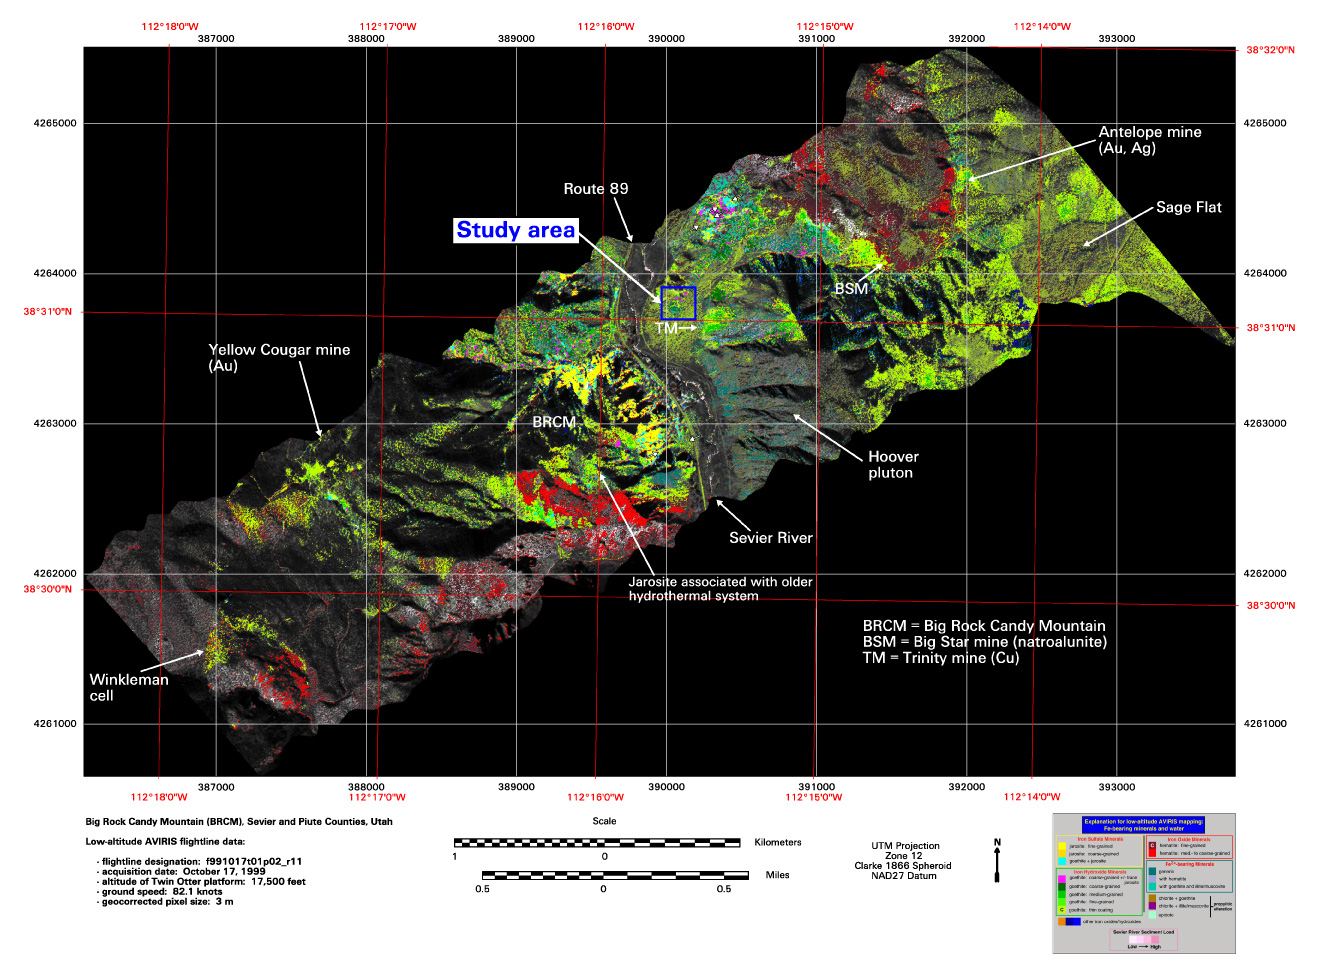
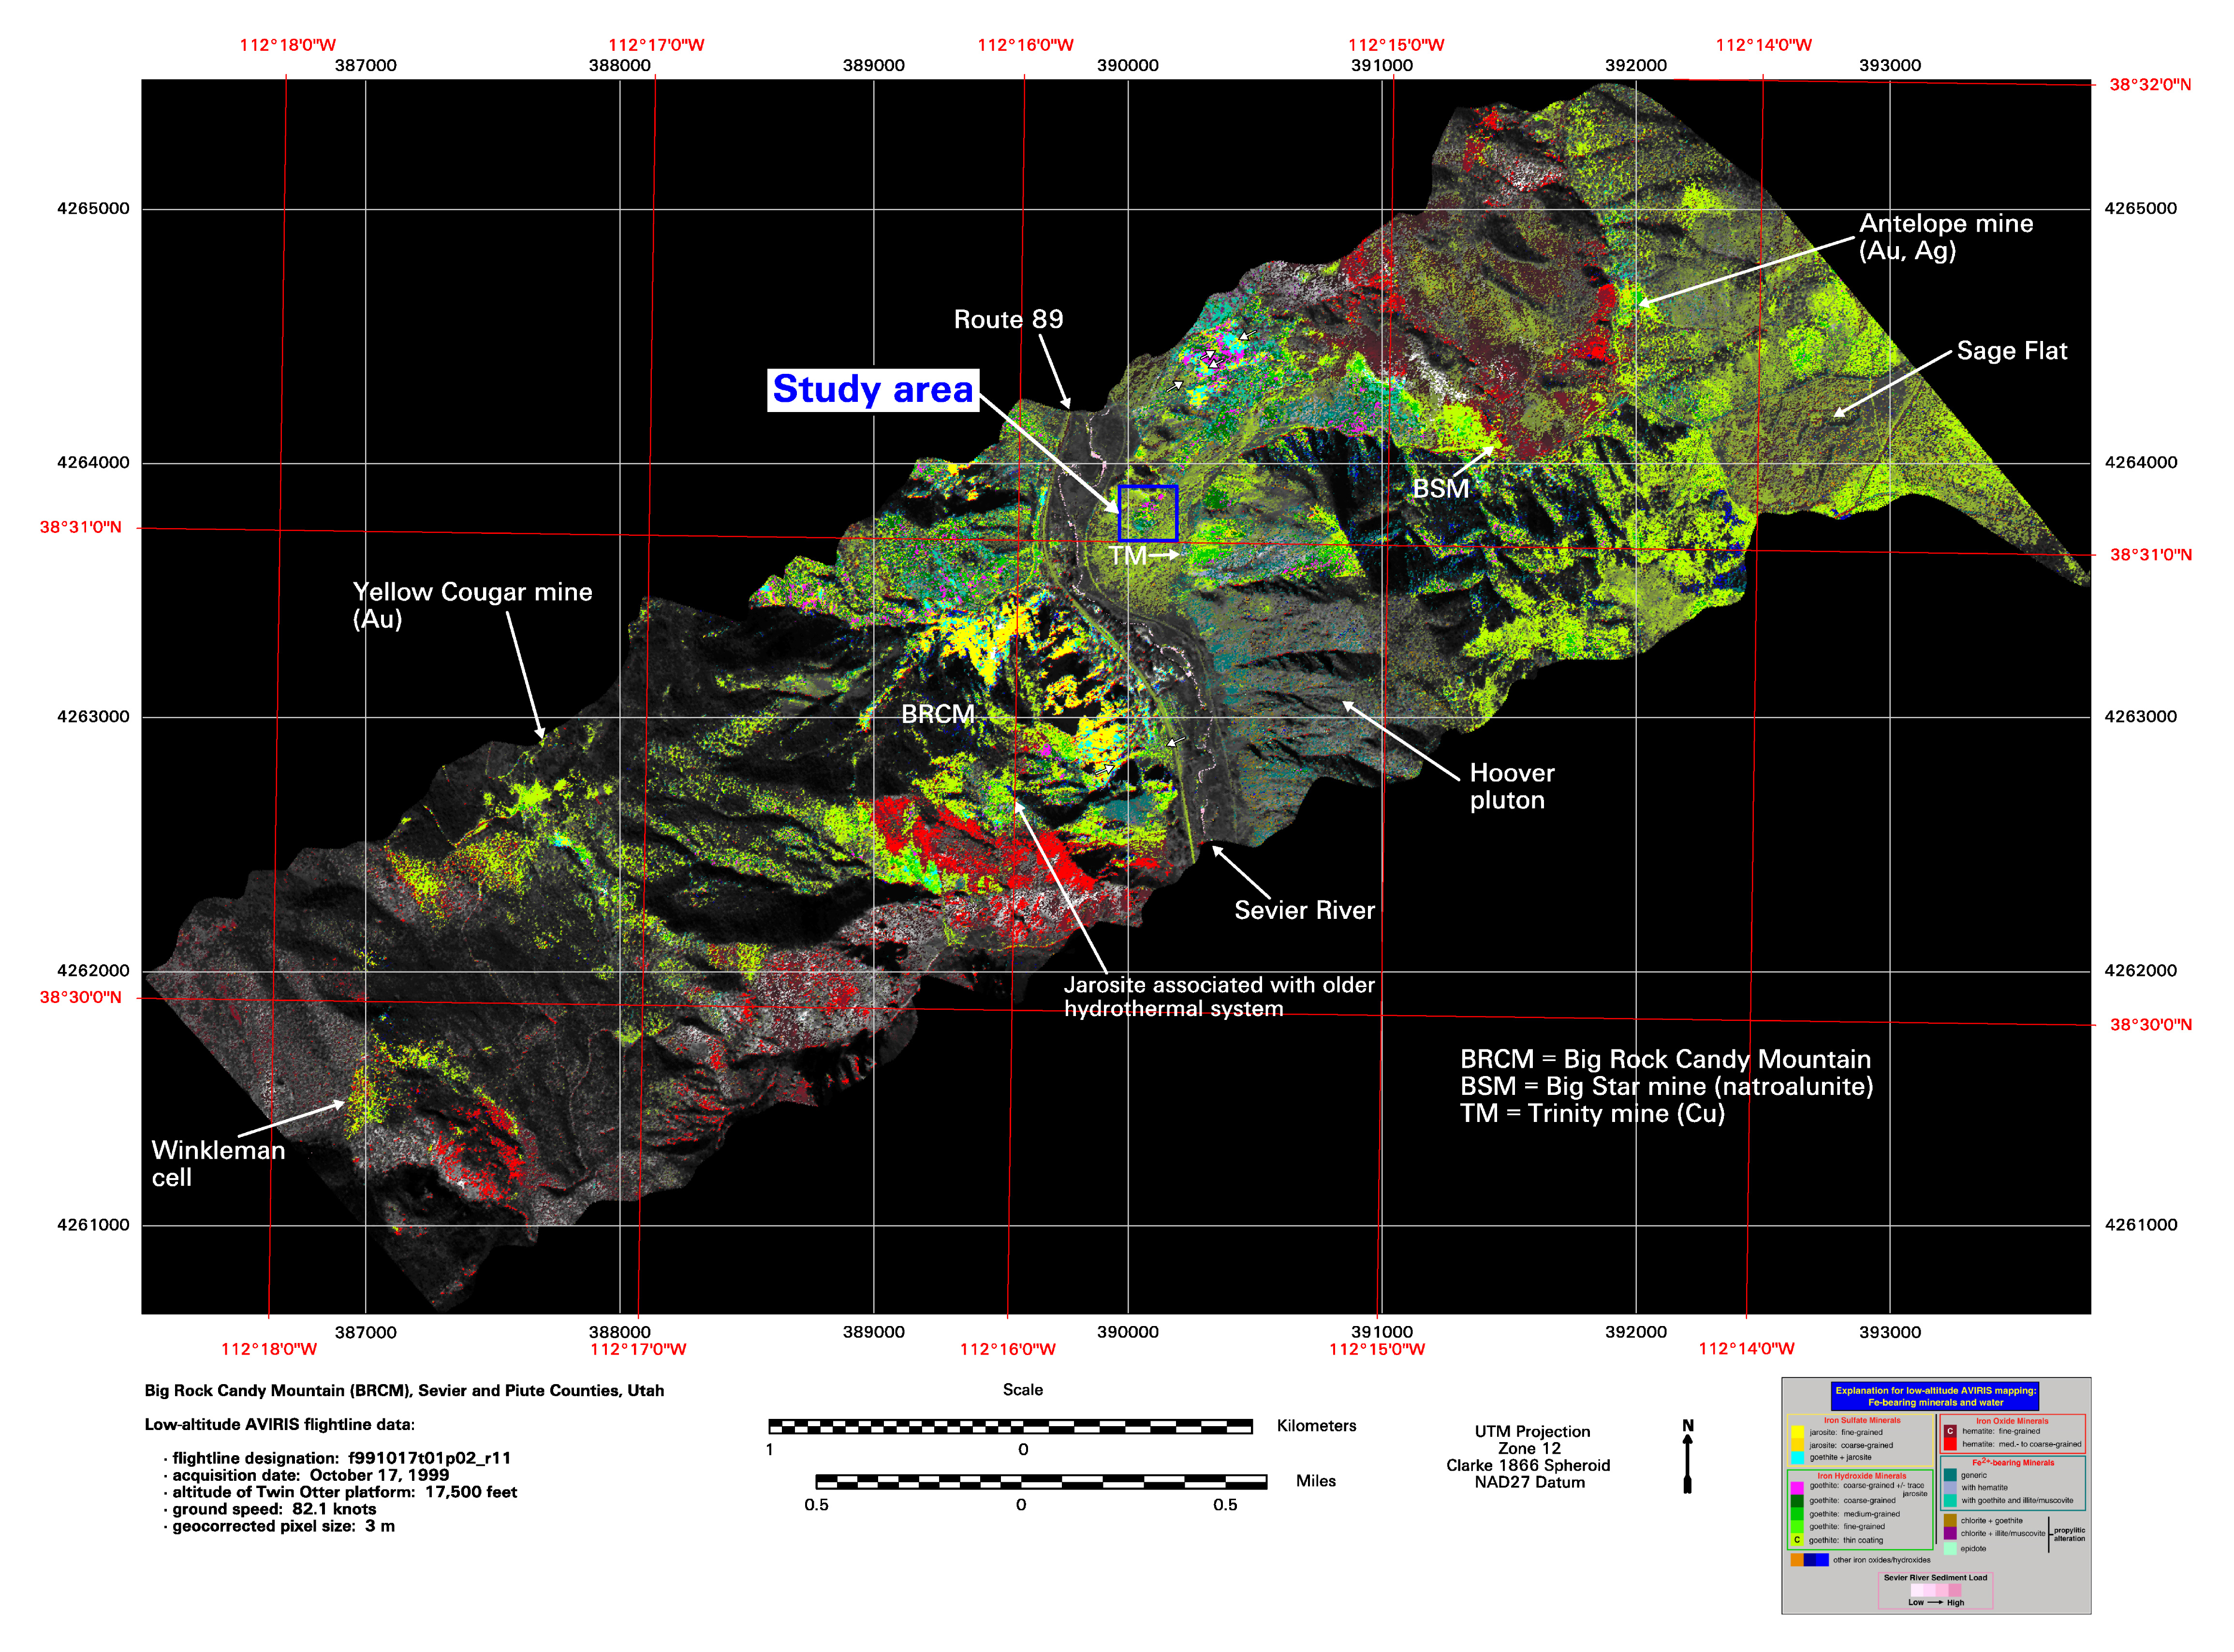
AVIRIS data acquired from the high-altitude ER-2 aircraft on August 5, 1998, and from the low-altitude Twin Otter turboprop aircraft on October 17, 1999, over the Big Rock Candy Mountain area of the Marysvale volcanic field in west-central Utah were analyzed using the USGS expert system (Rockwell and others, 2000; Rockwell and others, 2005; Cunningham and others, 2004). Figure 5 is a map of iron-bearing minerals and water interpreted from the low-altitude AVIRIS data, which has a ground instantaneous field of view (GIFOV) of ~3 m/pixel. Pixels identified as iron-bearing minerals are shown in solid colors (see map explanation of mineralogic color coding), except for pixels that matched the reference spectra of goethite thin coating or fine-grained hematite, which are each shown in a range of colors (a "continuous stretch") whose brightness is proportional to the fit × depth (fit times depth) values of that material (Rockwell and others, 2005; Clark and others, 2003a). Pixels with high fit × depth values are those where the AVIRIS spectrum had a high degree of least-squares fit to the reference spectrum and large absorption feature depths. Pixels with high fit × depth values for a given reference material depicted on the map with a continuous stretch are colored as shown on the map explanation, and pixels with lower fit × depth values are colored with successively darker shades of that color.

|
Figure 5. Map of iron-bearing minerals and water generated from AVIRIS data of the Big Rock Candy Mountain area, Marysvale volcanic field, Utah. Area from which rocks were sampled for this study (fig. 6) is indicated by the blue box. On this map, two spectrally identified mineral types are displayed through the use of continuous stretches in which the brightness level of the color selected for that assemblage decreases with decreasing spectral fit × depth of the material identification. Continuous stretches (marked "C" in map key) have been applied to fine-grained hematite and thin coatings of goethite. White arrows with black outlines show several examples of the gradation in mineralogy and(or) grain size associated with the weathering of pyrite-bearing rock mentioned in the text. View map in high-resolution, zoomable PDF format (5.62 MB) (use Acrobat 5+ to view). The figure is available for a closer view as a small or large JPG file. |
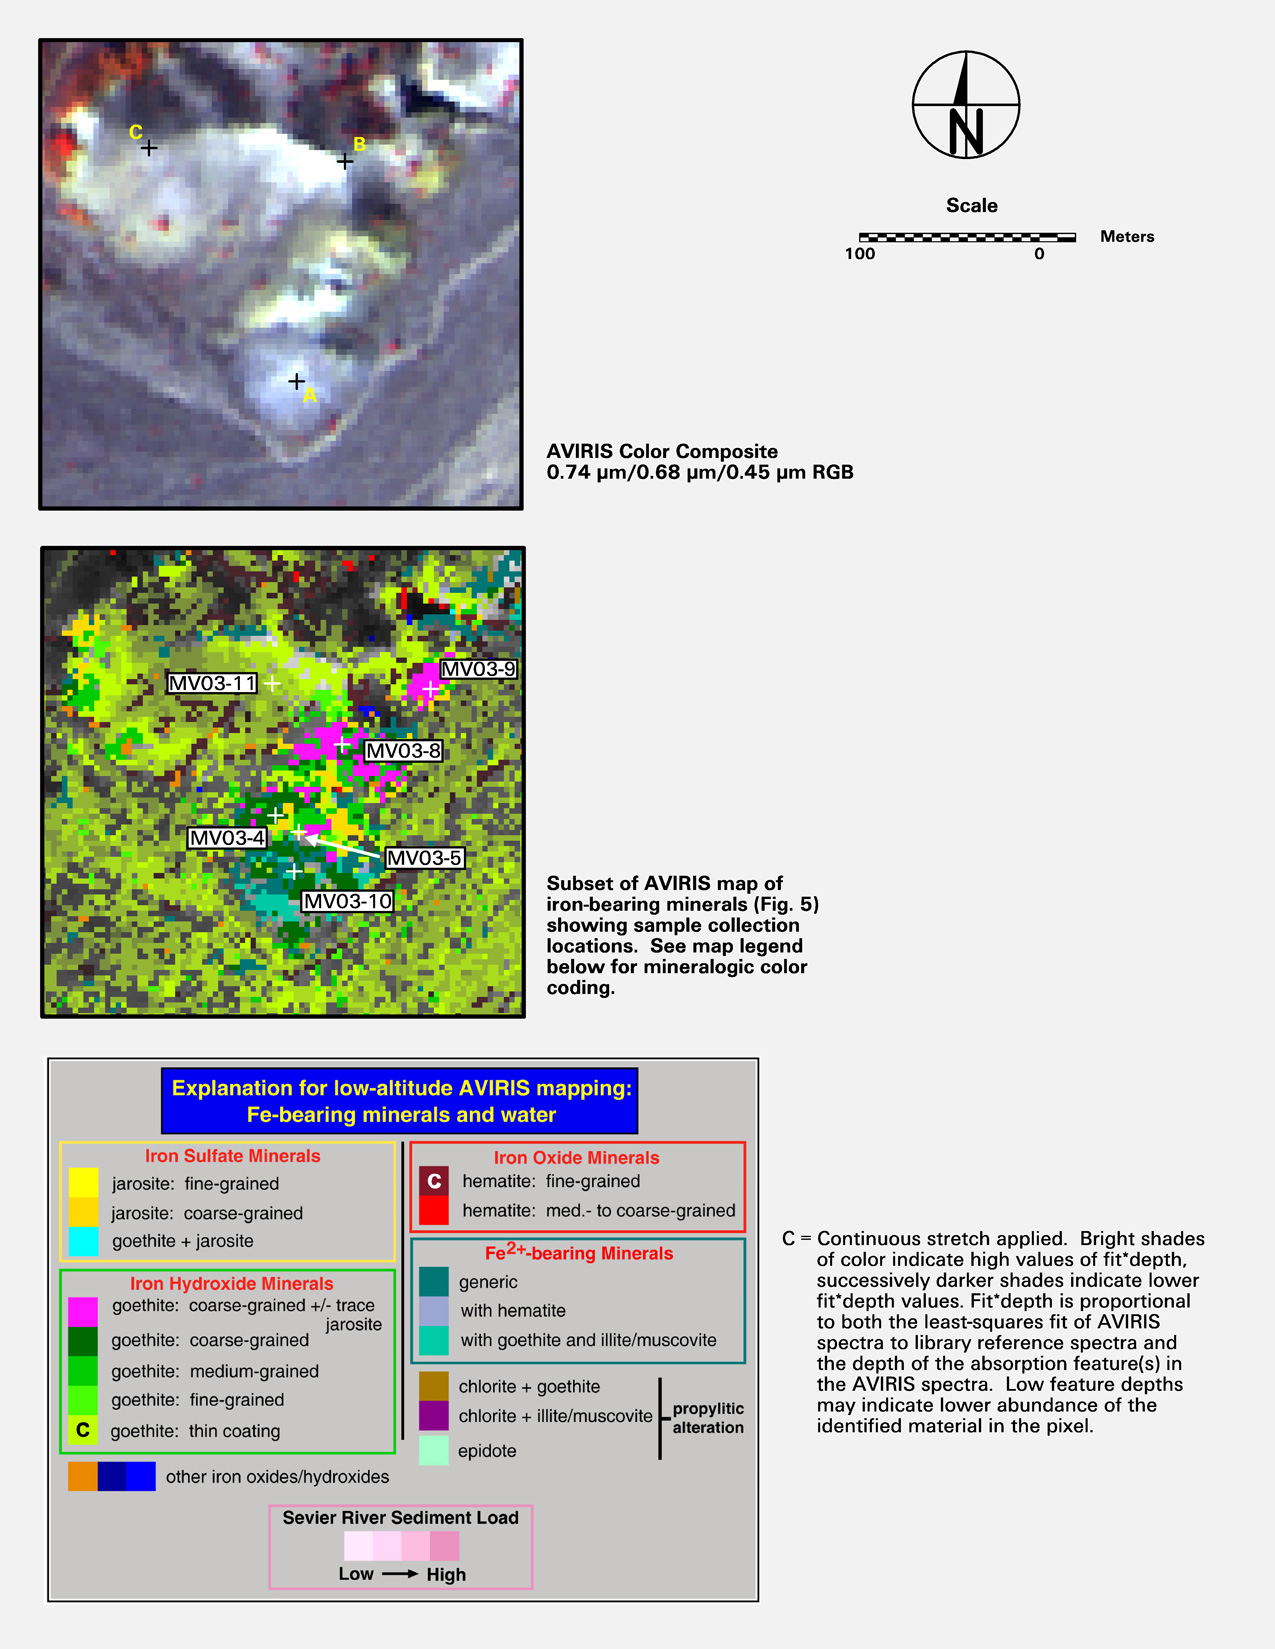
Figure 6 shows an enlargement of a portion of Figure 5 for the area from which rock samples were acquired for this study. This area is underlain by andesitic to dacitic volcanic rocks of the Miocene/Oligocene Bullion Canyon Volcanics (33 Ma) that were altered by one of several convective, near-surface, H2S-bearing hydrothermal systems that developed around a composite intracaldera intrusion of quartz monzonite (the Central intrusion) soon after its emplacement around 23 Ma (Cunningham and others, 1984; Rowley and others, 2002). The Hoover pluton, a quartz monzonite stock comprising the southwestern section of the Central intrusion, is indicated on figure 5 immediately east of the northward-flowing Sevier River. Immediately adjacent to the feeder zones of the hydrothermal systems, the volcanic and intrusive rocks have been propylitically altered and are rich in calcite, epidote, and chlorite.
Sample MV03-10 (fig. 6) was collected from propylitically-altered rocks in which muscovite and chlorite are abundant locally. In these rocks, local pyrite in trace amounts and(or) other iron-bearing minerals have weathered to goethite. From the AVIRIS data, the area immediately surrounding the location of sample MV03-10 mapped as coarse-grained goethite, "generic" ferrous iron minerals (including chlorite), or ferrous iron with goethite and illite/muscovite. Veins of calcite and quartz with greenish specks of copper-bearing minerals formed from volatile-rich fluids within the carapace of the stock cut the outcrop. At the Trinity mine approximately 300 m to the southeast (fig. 5), similar veins were mined for copper from skarn deposits within a thin block of Triassic and Permian metasedimentary rocks that was tilted upward at the edge of the stock.
The other sample locations shown on figure 6 are within narrow zones of intense propylitic alteration from the feeder zone of the Big Star hydrothermal system (Rockwell and others, 2005). These altered rocks are rich in pyrite and illite and were formed in reducing conditions well below the paleo-water table and the lower limit of boiling. The pyrite presently is oxidizing to natrojarosite, and acidic fluids generated by the oxidation process are currently forming supergene kaolinite, gypsum, and minor smectite similar to the exposed, yellow-colored flanks of Big Rock Candy Mountain less than a kilometer to the southwest. The most intensely altered rocks are found along WNW-striking fractures that cross the small N-S-trending ridge shown in the AVIRIS color composite image at the top of figure 6. Jarosite occurs along the fractures near the top of the ridge where pyrite is continually being exposed by erosion. Areas with abundant jarosite and(or) goethite on the surface appear as yellow to white on the AVIRIS color composite. Lower down the flanks of the ridge (sample MV03-4), goethite becomes more abundant at the expense of jarosite in coarse-grained alluvium derived from the altered rocks above. Sample MV03-11 was taken from the south-facing slope of an adjacent E-W-trending ridge that was sparsely covered with scattered cobbles of goethite-coated altered rock up to 20 cm in size, chips and angular cobbles of chlorite-bearing propylite, and relatively unaltered volcanic rocks. Sparse sage and dry grass were present in greater abundance there than on the more altered N-S-trending ridge, although light gray soil was extensively exposed between the cobbles and vegetation on the slope. The alluvium on this south-facing slope was a spectral match to the reference library spectrum of thin coatings of goethite, whereas samples from the more altered areas along and adjacent to the N-S-trending ridge were taken from areas that were spectral matches to coarse-grained goethite, coarse-grained goethite ± trace jarosite (reference library sample MPCMA2-C, figs. 2—4), medium-grained goethite, and coarse-grained jarosite from the reference library.
It is apparent from figures 5 and 6 that the number of pixels identified as thin coatings of goethite is far greater than the number of pixels identified as coarse- or medium-grained goethite, reflecting a greater areal extent of finer-grained, "distal" alluvium bearing only small quantities of goethite-bearing fragments as compared to goethite-bearing outcrop surface and coarser-grained, "proximal" alluvium. The "distal" alluvium mapped as thin coatings of goethite is comprised of soil, sparse vegetation, and fragments of both unaltered and goethite-bearing altered rock. Where pyritic rock is exposed, figure 5 generally shows a local outward gradation from outcrops with fine-grained coatings of jarosite, to aerial mixtures of jarosite and goethite, to coarse-grained goethite with trace jarosite, to coarse-grained goethite, intermediate-grained goethites, and finally to thin coatings of goethite. Some examples of this gradation are indicated on figure 5 by white arrows with black outlines. This gradation may be interrupted by local perturbations in lithology and(or) geomorphology, including where goethite is present that was formed directly by weathering of iron-bearing minerals (for example biotite or hornblende) in propylitically-altered volcanic rocks. Jarosite with "coarse-grained" features (match to spectrum of reference library sample BR93-34A2-r95 shown on figs. 2—4) may be identified instead of fine-grained jarosite coatings in areas where pyrite is less abundant and goethite has begun to replace and(or) cover older jarosite coatings, as is the case in the study area shown on figure 6. In general, both jarosite and coarser-grained goethite tend to occur closer to areas where active pyrite oxidation and acid generation are occurring.
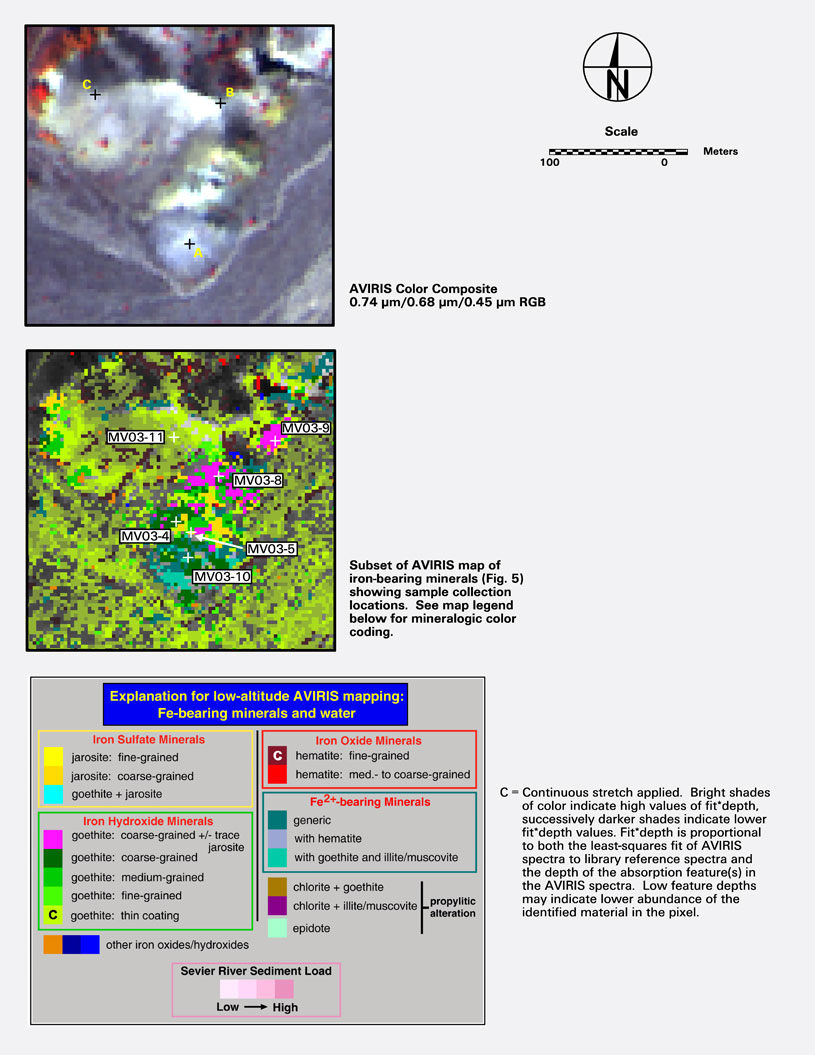 |
Figure 6. Enlargement of rock sample collection area from map of iron-bearing minerals shown on figure 5. In the AVIRIS color composite shown at top, the N-S-trending ridge underlain by jarosite- and goethite-bearing altered rocks mentioned in the text is located between points A and B, and the E-W-trending ridge underlain by less-altered rocks is located between points B and C. The figure is available for a closer view as a small or large JPG file. |
Figure 7 shows single-pixel high altitude AVIRIS spectra sampled from altered rocks of the Big Star cell. The colors of the spectra on figure 7 are similar to those of the goethite mineral classes on the mineral maps that they represent (figs. 5 and 6). Like the spectra in the hematite and goethite grain size series shown on figures 1—4, the goethite spectra on figure 7 show a general broadening and shift of the absorption position to longer wavelengths with increasing grain size. The spectrum identified as coarse-grained goethite with trace jarosite (spectrum #5, shown in magenta) shows a small shift of the absorption minimum back toward shorter wavelengths and a small feature at 0.43 µm, both indicative of a trace content of jarosite. However, the overall shape of the absorption feature near 0.9 µm is quite similar to that of the coarse-grained goethite spectrum shown in dark green (spectrum #4). A positive spectral feature near 1.1 µm in the spectrum of fine-grained goethite (spectrum #2) is a residual artifact caused by atmospheric water vapor.
Figure 7. Single-pixel reflectance spectra of altered rocks sampled from high-altitude AVIRIS data at the southwestern edge of the Big Star hydrothermal cell. Upper plot shows AVIRIS reflectance spectra. Lower plot shows same spectra in continuum-removed format in vicinity of crystal field absorption caused by ferric iron near 1.00 µm. The figure is available for a closer view as a small or large JPG file. |
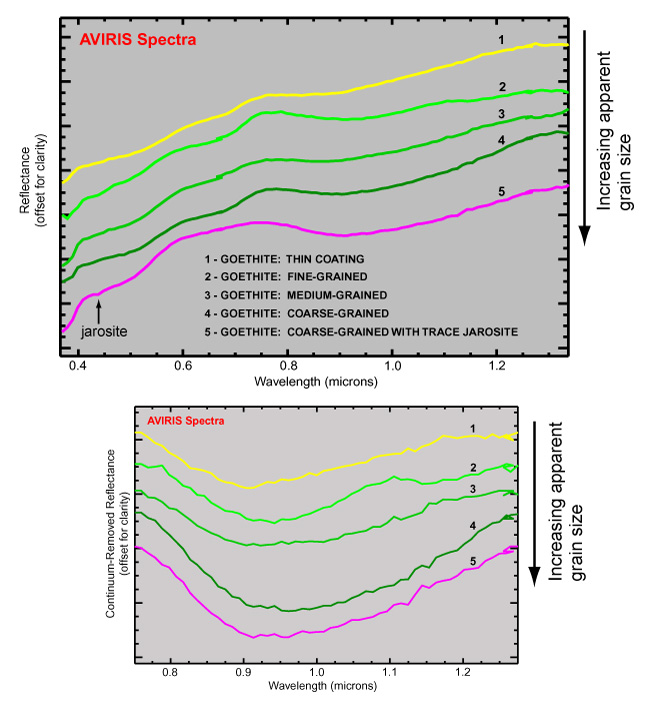 |
The AVIRIS spectrum that was a match to thin coatings of goethite (shown in yellow on fig. 7) is representative of the AVIRIS spectra of the south-facing slope from which sample MV03-11 was collected. Although the AVIRIS spectrum is dominated by the goethite from the rock fragments scattered across the surface, the extent to which the AVIRIS spectrum is affected by the small, dark fragments of chlorite bearing, propylitically altered rock and possible trace amounts of fine-grained ferric and(or) ferrous iron-bearing minerals (including goethite, chlorite, and epidote) in the light-gray colored soils is unknown. Further work is needed to sample and characterize the soils from this slope to determine what effect they may have on the AVIRIS spectra.
Rock samples were characterized spectrally in the laboratory with an ASD FieldSpec Pro FR spectrometer over the 0.35—2.50 µm range. Spectra of individual rock fragments were measured from sample locations MV03-11 (a—c) and MV03-10b (fig. 6). Rock fragments from the remaining locations (fig. 6) were measured in piles about 15 cm across and up to 5—6 cm in height. For each sample, 60 spectral measurements were integrated to generate a saved spectrum, and from 10 to 15 saved spectra were averaged together. The ASD FR spectrometer has three separate detector arrays that acquire data from different wavelength regions of the electromagnetic spectrum (array 1: VNIR, 0.35—1.05 µm; array 2: SWIR1, 1.00—1.80 µm; and array 3: SWIR2, 1.80—2.50 µm). In the averaged spectra, offsets in reflectance level between data acquired by each of the three detector arrays were computed and removed by extrapolating the linear trends from several channels at each end of the more stable SWIR1 array, calculating the offsets between the extrapolated trends and the first channels of the adjacent arrays, and adding the offsets to adjust all data from the adjacent arrays. The adjusted spectra then were converted to absolute reflectance through multiplication by the reflectance spectrum of the Spectralon white reference standard. The spectra in absolute reflectance format are shown on figure 8.
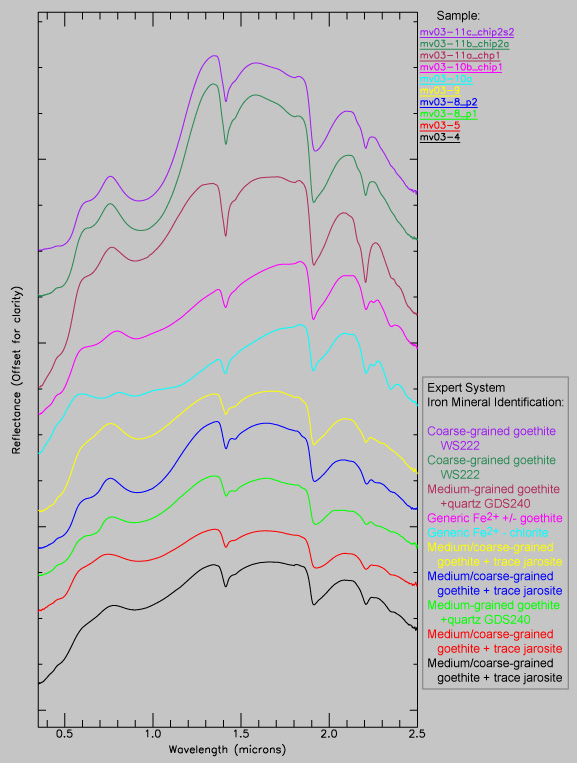
Final spectra were convolved to the wavelength centers and bandpass of the 1998 AVIRIS instrument by using a spline algorithm assuming Gaussian bandpass distributions and normalized to unity. These convolved spectra were analyzed with the expert system to determine iron mineral composition. The iron minerals identified by the expert system in each input spectrum are shown on figure 8 at lower right.
 |
Figure 8. Laboratory reflectance spectra of rocks sampled from the Big Star hydrothermal cell. Refer to figure 6 for sampling locations. Iron mineral identifications made by the expert system are shown at lower right. The figure is available for a closer view as a small or large JPG file. |
Rock fragments from sample location MV03-11, which mapped as thin coatings of goethite from the AVIRIS data, were identified as coarse- (two fragments) or medium-grained (one fragment) goethite from the laboratory spectra. Single-spectrum analysis by the expert system of rock fragments from the other sample locations generally agreed with the iron mineral and grain size identifications from the AVIRIS mapping (fig. 6).
The laboratory spectra of most of the rocks identified with AVIRIS as having spectral characteristics similar to those of medium- or coarse-grained goethite contained some spectral evidence of jarosite, although they were identified as goethite-bearing (± trace jarosite) with the expert system. The AVIRIS mapping identified coarse-grained jarosite in the immediate vicinities of sample locations MV03-4, MV03-5, and MV03-9. Field checking identified dark orange-yellow (typical of coarse-grained jarosite or a jarosite-goethite mixture) coatings of jarosite on pyritic rock at these locations, in addition to abundant goethite. The laboratory spectra of these samples were all identified as medium- to coarse-grained goethite ± trace jarosite (reference library sample MPCMA2-C, figs. 2—4) with the expert system, and evidence of jarosite is present in the spectra at 0.43 µm, 0.66 µm, 1.47 µm, and weakly at 2.27 µm. These spectra are similar to a reference spectrum of an intimate mixture of natrojarosite + illite + gypsum sampled from the pyritic feeder zone of the Big Rock Candy cell that is undergoing supergene weathering (sample BRCM-1; Rockwell, 2002), although the spectra presented here show no obvious evidence of gypsum. Several pixels matching the BRCM-1 reference spectrum were identified at the location of sample MV03-9 with the AVIRIS mapping in the SWIR region (Rockwell and others, 2005).
At sample location MV03-8, the AVIRIS mapping identified medium- to coarse-grained goethite ± trace jarosite (reference library sample MPCMA2-C, figs. 2—4), medium-grained goethite (reference library sample GDS240, figs. 2—4), and coarse-grained goethite (reference library sample WS222, figs. 2—4). The laboratory spectra of samples from this location were identified as either medium- to coarse-grained goethite ± trace jarosite (reference library sample MPCMA2-C, figs. 2—4) or medium-grained goethite (reference library sample GDS240, figs. 2—4). Fragments of propylitically-altered rocks near sample location MV03-10 were identified in the laboratory as bearing "generic" ferrous iron plus either chlorite (MV03-10a, pile) or goethite (MV03-10b, single rock fragment). Absorptions diagnostic of chlorite and muscovite are evident in the SWIR regions of these spectra.
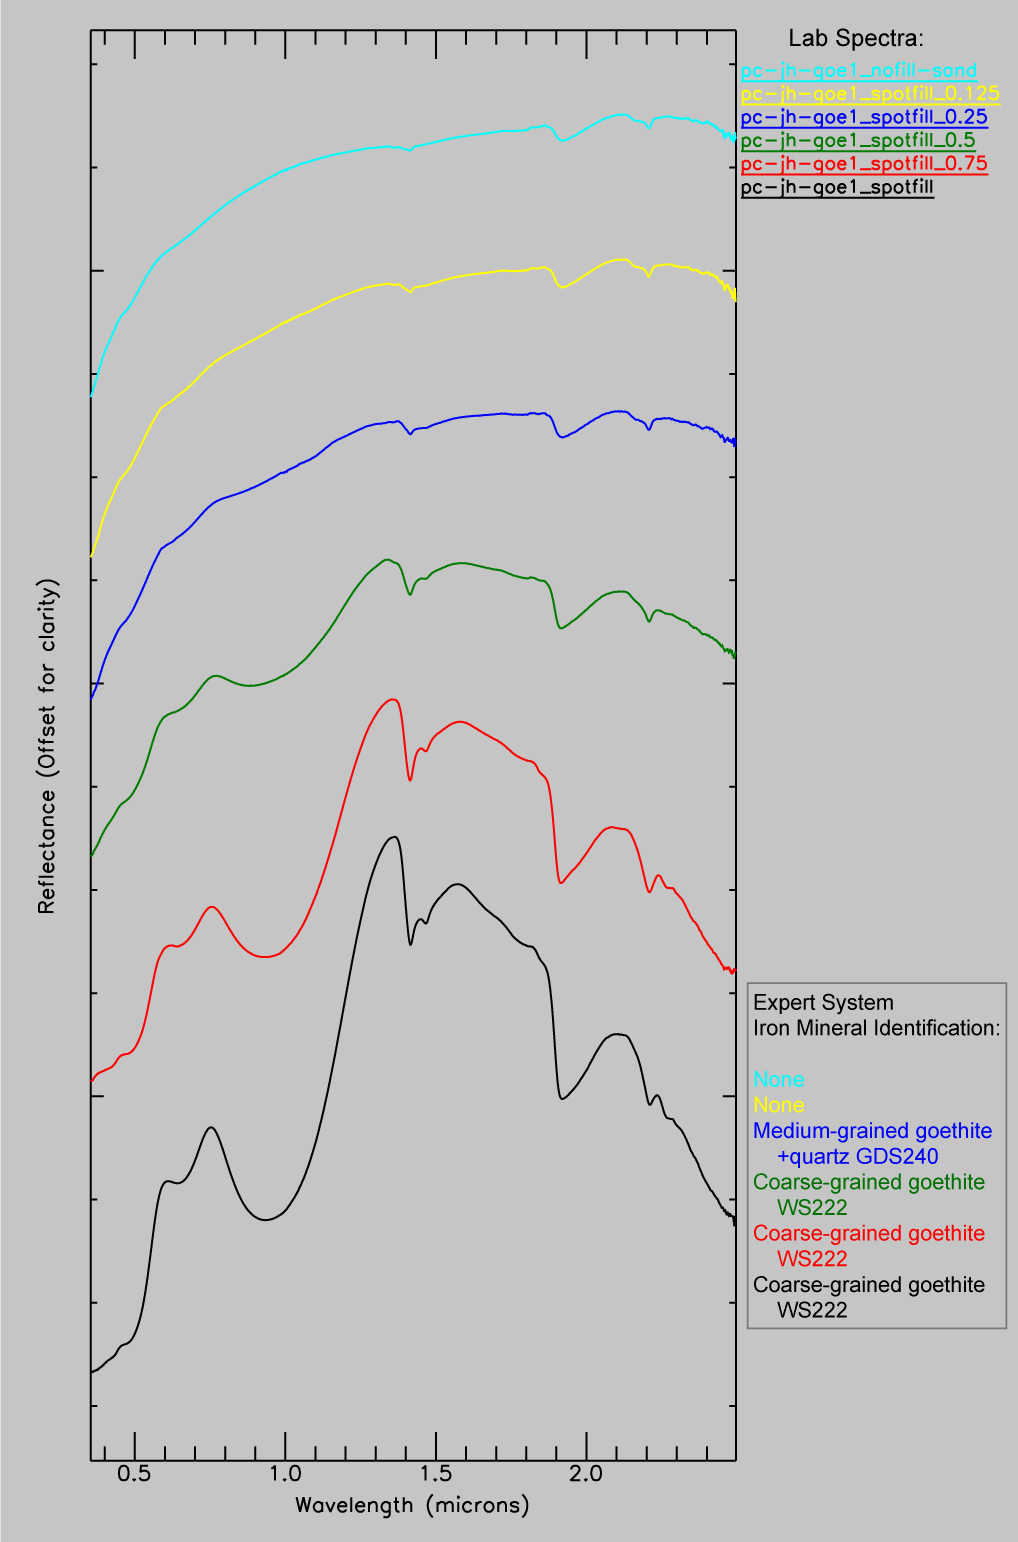
To determine if goethite abundance contributed to the spectral variations observed in goethite-bearing rocks with AVIRIS data, a laboratory experiment was performed in which spectra were acquired of a goethite-bearing rock while progressively decreasing the areal abundance of the rock with respect to a background of white, fine-grained quartz sand.
The fiber-optic cable of the ASD FieldSpec Pro FR spectrometer with a 25° field of view was positioned to view directly downward at a spot with approximately 10 cm diameter. A large, shallow tray wrapped in aluminum foil was covered with a layer of fine-grained white quartz sand approximately 2 cm in thickness. A single rock approximately 20 cm by 11.5 cm in size sampled from an altered fracture zone on Jupiter Hill southwest of Park City, Utah was placed on the sand and spectrally characterized for this experiment. Spectra were measured first with the rock sample covering 100 percent of the spot. This spectrum was named "spotfill." The rock sample was then moved in 2.5 cm increments across the spot, so that progressively less of the sample filled the spot relative to the background substrate of quartz sand. These spectra were named "spotfill_0.75," "spotfill_0.5," and "spotfill_0.25," respectively. For the next to last measurement, the sample was moved only 1.25 cm, generating the spectrum named "spotfill_0.125." Lastly, a spectrum of only the quartz sand was measured, generating a spectrum titled "nofill-sand." For each spectrum, 60 spectral measurements were integrated to generate a saved spectrum, and from 10 to 15 saved spectra were averaged together. The resultant spectra were reduced to absolute reflectance format as described above and are shown on figure 9. Final spectra were convolved to the wavelength centers and bandpass of the 1998 AVIRIS instrument by using a spline algorithm assuming Gaussian bandpass distributions and normalized to unity. These convolved spectra were analyzed using the expert system to determine iron mineral composition. The results of these analyses are shown on figures 9 and 10 at lower right.
Figure 9. Laboratory reflectance spectra of an altered rock (sample PC-JH-GOE1) measured in progressively decreasing abundance relative to a background substrate of white quartz sand. The lowermost spectrum (black) was acquired with the rock covering 100 percent of the viewed spot, and the uppermost spectrum (cyan) represents only the background substrate. A weak Al-OH vibrational absorption doublet near 2.2 µm is evidence of trace amounts of kaolinite in the quartz sand. The figure is available for a closer view as a small or large JPG file. |
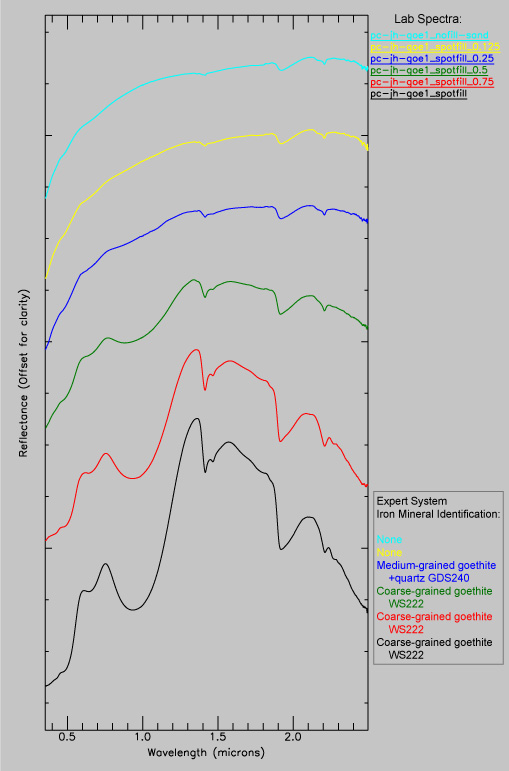 |
It is evident from figure 9 that the quartz sand contains trace amounts of kaolinite, but no strong electronic absorptions due to iron are present in the VIS/NIR spectral region. The expert system identified no iron minerals in the quartz sand spectrum ("nofill-sand"). A bulk XRD analysis of the rock (sample PC-JH-GOE1) found major (>25%) quartz and trace (<5%) montmorillonite, jarosite, goethite, and kaolinite. Although weak absorptions caused by jarosite are present in the spectrum of sample PC-JH-GOE1 at 0.43 µm, 1.47 µm, and 2.27 µm, there appears to be little evidence of jarosite in the vicinity of the large crystal field absorption near 1.0 µm. The spectrum of the rock filling the spot ("spotfill") was identified as coarse-grained goethite (reference library sample WS222, figs. 2—4) by the expert system. Spectral measurements across the width of the rock did not reveal substantial variations in spectral shape that could reflect local changes in grain size or mineral composition on the rock surface. It is not known if multiple scattering effects and(or) shadowing affected the resultant spectra in this experiment. Shadowing was minimized by the vertical alignment of the light source directly above the rock/sand surface. Figure 10 shows the spectra in continuum-removed format in the vicinity of the goethite absorption feature near 1.0 µm.
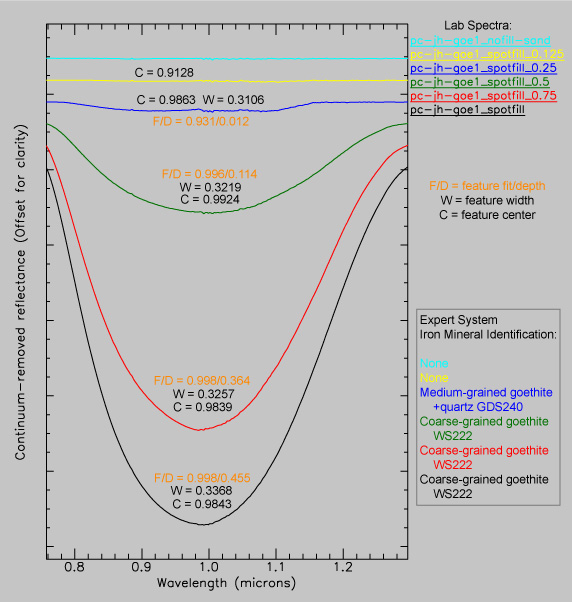 |
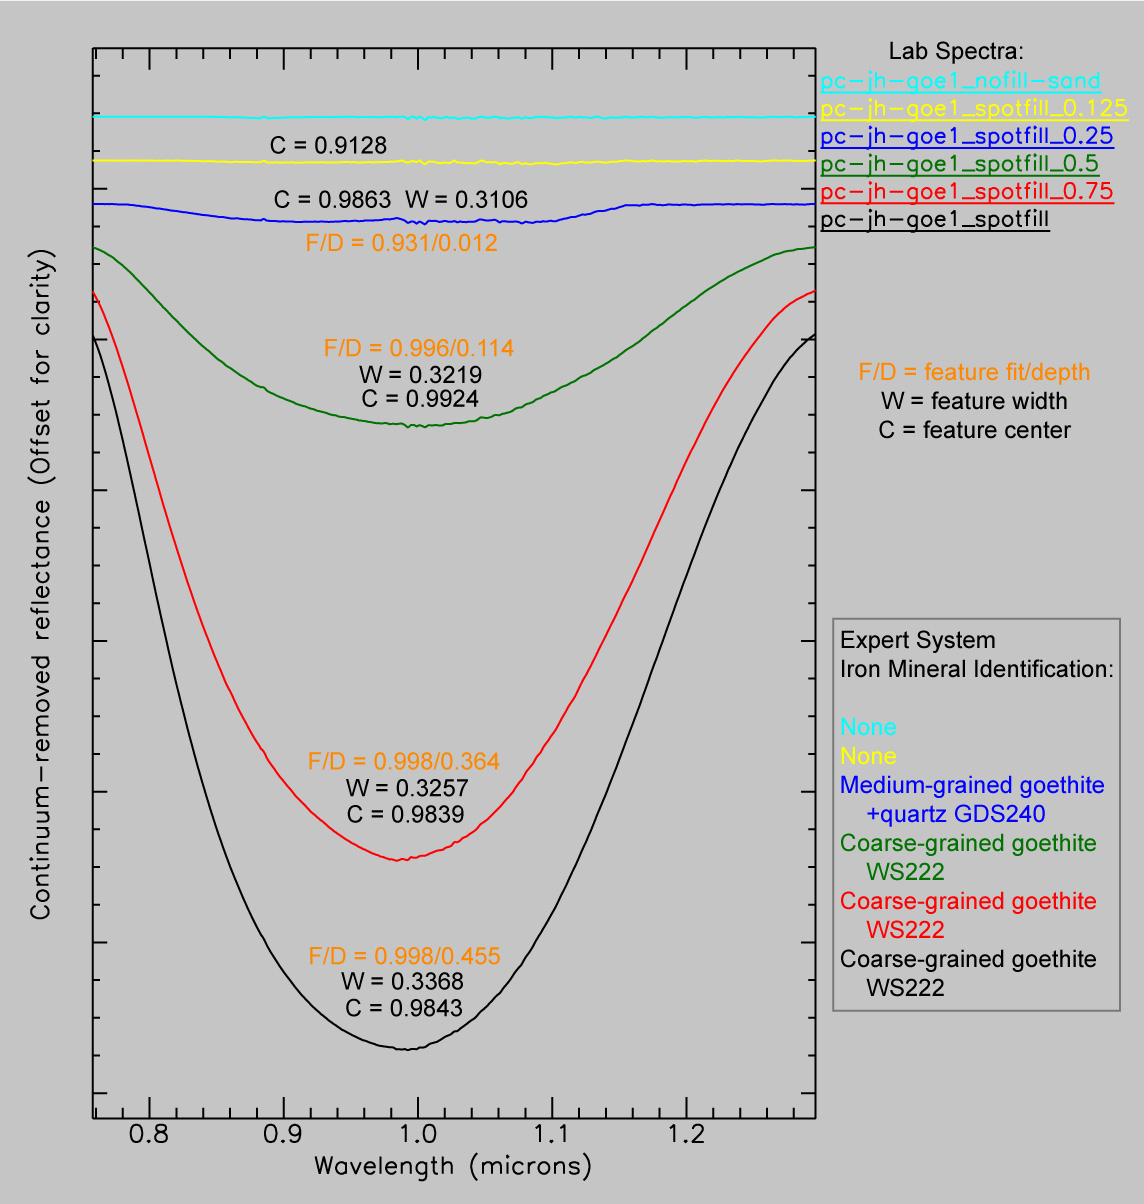
Figure 10. Crystal field-absorption features caused by goethite near 1.0 µm in spectra shown on figure 9. Feature widths, depths, and center wavelengths are shown, as are degrees of least-squares fit of each spectrum to the identified reference spectra indicated at lower right. The figure is available for a closer view as a small or large JPG file. |
Figure 10 shows that the spectra of the rock in high areal abundance relative to the quartz sand were identified as coarse-grained goethite by the expert system, and a spectrum of the sample covering less than one third of the quartz sand-covered spot was identified as a medium-grained goethite. As the areal coverage of rock in the spot viewed by the spectrometer decreased, the widths and depths of the goethite feature near 1.0 µm also steadily decreased. The band centers of the feature remained nearly constant at first, but then increased by 0.0085 µm ("spotfill_0.5") before decreasing back to nearly the original values in the spectrum of "spotfill_0.25." The center value of the weak feature present in the "spotfill_0.125" spectrum shifted strongly to shorter wavelengths. Whereas the continuum endpoints at the long wavelength side of the feature were located between 1.29 and 1.32 µm for the first three spectra of goethite in substantial abundance ("spotfill," "spotfill_0.75," and "spotfill_0.5"), the endpoints shifted substantially to shorter wavelengths in the "spotfill_0.25" (1.16 µm) and "spotfill_0.125" (0.99 µm) spectra. In the reference library spectra (fig. 3), the long wavelength continuum endpoint is located at longer wavelengths for medium- and coarse-grained goethite than it is for the thin coatings of goethite. Values of modified least-squares curve fit between measured and reference spectra generally remained constant until the rock filled only a small portion of the spot ("spotfill_0.25"), at which point the fit substantially decreased because of the increased influence of noise.
Rock samples were obtained from rock outcrops and alluvium identified as containing goethite and(or) jarosite with AVIRIS data. Most samples were taken from areas differentiated by the expert system as having spectral properties similar to goethites of varying grain size. These samples were characterized with a laboratory spectrometer, and the resultant spectra were analyzed by the expert system to determine iron mineral composition.
The accuracy of the iron mineral identification results obtained by expert system analysis of the AVIRIS data was confirmed. Rocks identified as medium- to coarse-grained goethite ± trace jarosite from the AVIRIS data were found to contain mainly goethite with trace jarosite, and were characterized by a primary crystal field absorption feature near 1.0 µm similar to that of coarse-grained goethite, with weak absorption features caused by jarosite present elsewhere in the spectra. Alluvial surfaces identified as thin coatings of goethite using the AVIRIS data were sparsely covered with coarse-grained chips and angular cobbles up to 20 cm in size of goethite-coated altered rock, chlorite-bearing propylite, and relatively unaltered volcanic rocks on a surface of light-gray soil with sparse dry vegetation. In general, the expert system was accurate in identifying medium-grained goethite, coarse-grained goethite, medium- to coarse-grained goethite with trace jarosite, and mixtures of goethite and jarosite.
Rock fragments from areas identified as coarser-grained goethite and thin coatings of goethite with the AVIRIS data were found to consist mainly of medium- to coarse-grained goethite and have similar spectral characteristics. Given the geochemical rationale for the development of goethite coatings at the expense of jarosite coatings over time from waters of decreasing acidity adjacent to outcrops of oxidizing pyritic rocks proposed by Swayze and others (2000), it follows that the thickness of goethite coatings could increase with increased distance from exposed pyritic rocks that are weathering to jarosite. Assuming that new goethite will accumulate as growths on existing goethite grains, the grain size of the goethite coatings would be expected to increase as the coating thickness increased. Thus, it appears unlikely that changes in crystal grain size alone are responsible for the spectral variations in goethite-bearing rocks and alluvium observed using AVIRIS data that resulted in the identification of thin coatings of goethite.
Spectroscopic principles suggest that, assuming constant material composition and grain size, variation in the abundance of a material should affect mainly the depth of a diagnostic absorption feature, and not its shape (Clark, 1999). The experiment to determine the spectral effects of variation in material abundance found that, with decreasing material abundance, the absorption feature of goethite near 1.0 µm decreases in depth and narrows more from the long wavelength side of the feature than from the short wavelength side. This phenomenon also is observed in reference library samples of goethite (Clark and others, 2003b). The reference library spectra of fine-grained goethite and thin coatings of goethite are characterized by electronic crystal field absorptions near 0.9 µm that are narrower, shallower, and located at shorter wavelengths than the absorptions of coarser-grained goethites which are broader and more saturated. Therefore, it appears that, in the Marysvale study area, goethite-bearing alluvium downgradient from source outcrops tends to be identified as finer-grained or thin coatings of goethite due to the mineral's presence in lesser abundance. Coarser-grained goethite, with deep, broad, and often saturated features, will most likely be correctly identified in areas of greater goethite abundance proximal to jarosite-bearing source rock where the feature is relatively free of corruption by goethite-free soil components and vegetation. For these reasons, goethite-bearing alluvium is a closer match to reference spectra of thin coatings of goethite even though the actual grain size of the contained goethite is the same on average as that from the source outcrops.
Further work is needed to understand the effects of soil mineralogy and grain size on the AVIRIS spectra of the primarily alluvial surfaces identified as thin coatings of goethite. The widespread occurrence of alluvium identified as thin coatings of goethite using AVIRIS data adjacent to altered rocks has been observed in a variety of geologic terrains and deposit types (Rockwell and others, 2005; Livo and Clark, 2002). Thus, it appears unlikely that the alluvial soils at the Marysvale study area identified as thin coatings of goethite contain a distinct assemblage of minerals (for example goethite ± chlorite ± epidote) and grain sizes that mimic the spectral shape of the reference spectrum of thin goethite coatings. However, as chlorite is a common constituent of propylitic alteration assemblages that surround areas affected by advanced argillic, argillic, and(or) phyllic alteration, its influence on the spectral properties of alluvium derived from the altered areas should be explored further.
When analysis of imaging spectroscopy data is performed using reference spectra of iron minerals of varying grain sizes and mixed compositions, the results are useful not only for purposes of mineral identification, but also for distinguishing goethite-bearing outcrop from alluvial surfaces with similar mineralogy, providing valuable information for geologic, geomorphologic, mineral exploration, and environmental assessment studies.
The author would like to send a special thanks to Robert O. Green and the rest of the AVIRIS team at NASA's Jet Propulsion Laboratory for providing the high-quality remote sensing data upon which this research was based. He also would like to thank Robert J. Horton of the USGS for providing the quartz sand used for the goethite abundance experiment. Daniel H. Knepper, Jr. and Trude V. V. King of the USGS supported this research as a part of the Remote Sensing Project. Special thanks also go to Daniel H. Knepper, Jr. and K. Eric Livo of the USGS for their helpful reviews of this manuscript.
| AccessibilityFOIAPrivacyPolicies and Notices | |
| |
|