
Digital Mapping Techniques '04— Workshop Proceedings
U.S. Geological Survey Open-File
Report 2004–1451
Geologic Web Services, Planning and Design
Illinois State Geological Survey, 615 East Peabody Drive, Champaign, IL 61820; Telephone: (217) 244-9306; Fax: (217) 333-2830; e-mail: beavrsn@isgs.uiuc.eduINTRODUCTION
Illinois State Geological Survey (ISGS) staff members have been developing interactive maps since June, 2001. These web resources provide access to scientific data for a diverse array of audiences. This paper will present the planning procedures developed, and technical lessons learned, from the successful completion and public release of multiple interactive maps.
Map Services and Interactive Maps from the ISGS
The Open Geospatial Consortium (OGC; http://www.opengeospatial.org/) Web Map Service Specification (WMS 1.3) states that a web map service (WMS) “produces maps of spatially referenced data dynamically from geographic information” and that “WMS-produced maps are generally rendered in a pictorial format such as PNG, GIF, or JPG” (Beaujardiere, 2004). In this paper, the term ‘map service” represents the active service created in ArcIMS Administrator, referencing the .mxd map document developed with ArcMap software. The term “interactive map’ collectively represents a map service and the accompanying collection of HyperText Markup Language (HTML) .html files and javascript .js files that allow a web visitor to query and customize pictorial data display.
The ISGS currently publishes map services with the use of ESRI ArcIMS 4.0.1 software (http://www.esri.com/). This software is further supported by ESRI ArcMapServer4.0.1 software, to enable the utilization of .mxd map documents generated by ESRI ArcMap 8.3 Geographic Information Systems (GIS) software.
The ISGS has released five interactive maps and two map services at multiple web sites. These are available at:
Illinois Digital Orthophoto quarter Quadrangle (DOQ) files from National Aerial Photography Program Three flights. Map initially released in June, 2001. Revised version released July, 2004.
Illinois Historical Aerial Photographs, 1936 through 1941. Map initially released in September, 2003. Revised version released October, 2004.
Illinois Oil and Gas Resources, with access to more than 180,000 oil and gas wells. Map initially released in February, 2004. Revised version released November, 2004.
Illinois Natural Gamma-Ray Logs; released in June, 2004.
Illinois Water and Related Wells, with access to more than 275,000 water, engineering, and stratigraphic wells. Map released in July, 2004.
Map services featuring data for Illinois have also been developed for the Midcontinent Interactive Digital Carbon Atlas and Relational dataBase (MIDCARB; http://www.midcarb.org/) project, the National Interactive Digital Carbon Atlas and Relational dataBase (NATCARB; http://www.natcarb.org/) project, and for a custom file-sharing application for the ISGS and the Illinois Department of Transportation.
GEOLOGIC WEB SERVICES
Project Planning
To develop an interactive map, a complex sequence of steps has been delineated. This multi-phased approach has proven to be crucial, in order to usher a project smoothly through the various stages of planning, development, and testing, to public release.
Define the Scope of the Project
The first project phase introduces team members to obstacles inherent in the development of an interactive map. Scientific staff unfamiliar with GIS software may need a demonstration of the fundamental differences between paper and interactive maps. A demonstration should be held to review scale dependent rendering of data layers, outline priorities for allocating computer screen real estate between the various map manipulation controls and data display frames, and illustrate the limited viewing area available for the central map frame.
Initial discussions will logically lead to a review of potential data layers to be featured. It is important to decide on the order of data display as early in the project planning process as possible, to save time while implementing data-specific programming customizations. A series of meetings will be needed to accomplish this task, as this is an iterative process. It is the responsibility of the GIS specialist to guide the team into making decisions about logically ordering the collection of data layers. Data layers must be ordered in a vertical sequence that conforms to the rendering capabilities of GIS software. Data layers featuring points and lines must overlay layers featuring polygons, which can in turn overlay base imagery. Reference data, including points, lines, polygons and imagery will provide familiar context for the interactive maps’ feature data layers, be they points, lines, or polygons.
An all-inclusive list of potential data layers (Table 1) should be provided at the initial meeting, to enlist help in identifying inappropriate data. A list that seems overwhelming in length should inspire the team to limit reference data options, in favor of showcasing the feature data layers. Presenting an abbreviated list of reference data to the team will cause “what about my favorite data” additions, which can lengthen the overall list by tens of data layers. This is counter-productive to the ultimate goal for the project, which is to guide web visitors to the feature data quickly and logically.
| Table 1. Sample of an all-inclusive list of data layers,
order determined by the rendering capabilities of GIS software. |
||
| • Reference Data (lines and/or points) | • Key Data (polygons) | |
|
|
|
| • Reference Data (polygons) | ||
|
||
| • Key Data (lines and points) | • Reference Data (imagery) | |
|
|
|
Team members should be encouraged to approach project development with the goal of creating a tightly focused application. Data heavy applications tend to run slowly, and overwhelm new users with their large number of map customization options. An application incorporating such traits will cause customers to quickly become dissatisfied with the interface, and leave the web site before achieving their research goals.
Another early goal in the planning process is to identify the primary target audience. Potential audiences can be broken down into the broad classifications of Internet, Extranet, or Intranet. Resources available on the Internet are accessible to the general public. This can include landowners, policy makers, industry consultants, K–12 educators and students, and many others. Extranet, or inter-agency, resources can be targeted to a professional audience; people familiar with geologic maps. These customers include surveyors, drillers, college instructors and students, exploration geologists, or private consultants. Intranet resources, geared toward internal agency staff, can be customized for an audience with fast, in-house network connections, uniform access to support software, and clearance to confidential data elements.
Project Design
Data Collection and Assessment
The second project phase is simple in scope, but time-consuming to complete. It involves the collection, assessment, and cartographic display of reference and feature data resources. Assessment of existing data layers may trigger modifications based on incompatible data file formats, the need to construct data sub-sets and/or screen confidential data, and requirements for programming custom data attribute display or hyperlink capabilities. Compilation of detailed information about the cartographic display of each data layer can prove to be an invaluable time-saving exercise. Sources of previously determined cartographic standards and symbols for feature data may be found on published maps, described in journal articles, archived in digital symbol sets, or recorded in the attribute definition fields of metadata files.
Development of the Map Document
Once the data layer order has been established and any necessary data revisions have been completed, development of the map document can commence. Tasks include importing base and feature data layers, and setting cartographic display parameters for individual data layers. Minor revisions to the established order of data layers will become evident during development of the map document, with respect to emerging complexities with information display. All project team members should be given a preliminary demonstration of the map document, so the GIS specialist can compile their feedback and address their concerns.
After issues resulting from the preliminary feedback have been addressed, technical staff can apply the pre-determined customizations to the map document and support files. Such customizations could include: selecting a sub-set from the complete list of data attributes archived for each data layer, substituting easily interpreted aliases for scientific codes, enabling hyperlinks to related documents or images, and creating short but intuitive labels for data attribute fields. Because of the complexity of these tasks, it is important to delay these programming customizations until after the data order has been finalized and approved
Beta Testing, Round One
The first round of formal beta testing should be open to all team members to ask them to provide input on all features of the interactive map and the array of map tools in the display. Relevant areas for review are: font selection and font size, display of data layers, cartographic distinctiveness of data attributes, appropriateness of maximum and minimum settings for scale-dependant rendering of each data layer, display characteristics between multiple data layers with respect to symbology and settings for scale dependant rendering, required map manipulation and query tools, and completeness and usability of the overall interface. This level of review should be lengthy and in-depth.
Customization of the overall web page in which the interactive map frames are embedded should be delayed until this phase has been completed. A web interface that appears to be nearly complete can inspire reviewers to limit their editorial input, and thereby leave serious design flaws undiscovered. Fixing such flaws can be extremely time-consuming if done in a later phase of project development.
Beta Testing, Round Two
The second round of beta testing should be opened to all team members, agency management, and other interested staff members. Technical staff should seek input to ensure that previously identified editorial points have been addressed, verify that no new problems have been created, and certify that no major flaws were overlooked in round one testing. It is also constructive to solicit review from other developers of interactive maps. If the map tools, data display, and navigation elements aren’t intuitively designed, these technical consultants will quickly identify key problem areas. This level of review should focus primarily on cosmetic features.
Project Completion
Support Documentation
The standard array of software required for accessing an interactive map will incorporate data, database software, software for map service presentation and customization, web server software, operating system software, plus other plug-ins or standalone components. Because of this complexity, it is advised that all map access be routed through a hyperlink on a single web page. Notices about map service interruptions, support documentation, and project information can also be featured at this location.
Support documentation should be provided for a variety of project details. Information about the overall project, appropriate metadata, an outline of the map tools (Figure 1) and default navigation settings (Figure 2), and a detailed legend (Figure 3) are useful to on-line customers. Prior to public release, the support resources and the interactive map will benefit from a final review by editorial staff, a professional cartographer, and the agency webmaster.
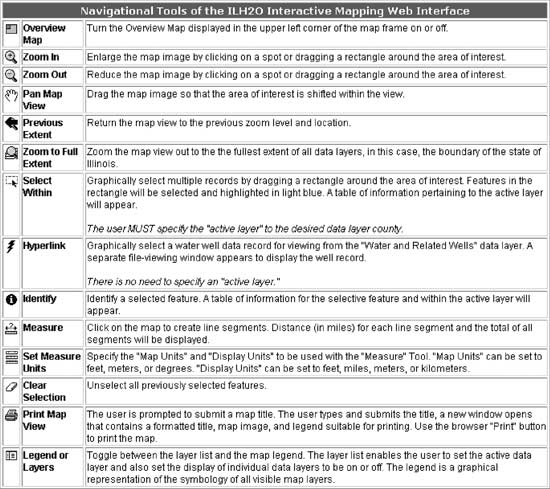 |
Figure 1. Detailed description of navigational tools inherent in the interactive map, available at http://www.isgs.uiuc.edu/wwdb/launchims.htm. |
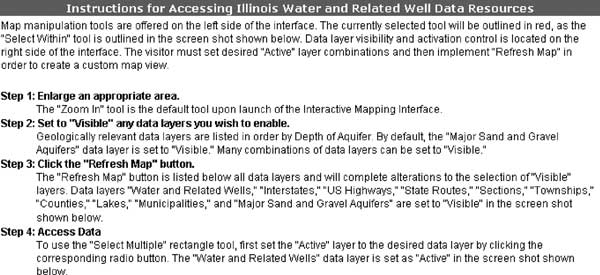 |
Figure 2. Instructions for interacting with the data and customizing
the map display. |
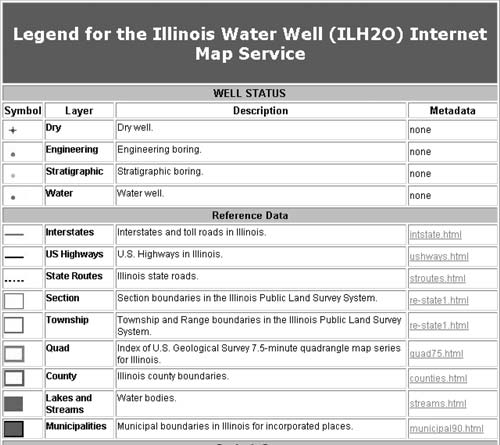 |
Figure 3. Legend for all data layers included in the interactive map, including cartographic symbols, data layer descriptions, and hyperlinks to metadata files. |
Navigation Strategies
While Internet consumers are familiar with tools embedded in web browser software, they are unfamiliar with map manipulation tools and the ways in which interactive map components can either work in tandem with or counteract browser tools. It is advisable to utilize the default map tool icons provided by the software provider, to educate users about the basic characteristics of interactive map tools over time. An agency should also create and adhere to design standards for the layout of all interactive maps. Adherence to such standards will, with each new project release, teach visitors where to look within the layout of each map for the controls to query data and customize data display (Nielson, 1999). Other methods to improve the usability of the map itself would be to group map tools into useful categories and provide intuitive, abbreviated descriptions of each tool function (Figure 4).
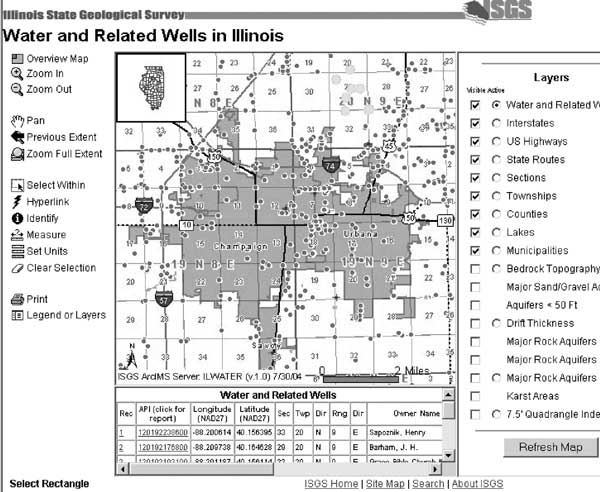 |
Figure 4. The “Water and Related Wells in Illinois” interactive
map published by the ISGS. Map tool descriptions (Zoom In, Pan, Identify,
etc.) have been included to improve the usability of the map. |
Enthusiastic adoption of a new interactive map by the target audience will require advertisement. Promote the project release at workshops and professional conferences with “how-to” navigation demonstrations. Newly developed interactive maps are typically presented to project funding supporters, at agency seminars and at meetings of the state GIS Association.
ACKNOWLEDGMENTS
The following staff members made significant contributions to the development of geologic map services at the ISGS: Steven Gustison, Christopher Korose, Robert Krumm, Alison Lecouris, Christopher McGarry, and Daniel Nelson. Editors included Jonathan Goodwin and Robert Krumm of the ISGS, and David Soller of the United States Geological Survey. Project support has been provided by many state and federal agencies, including the Illinois State Geological Survey, the Illinois Department of Natural Resources, the Illinois Department of Transportation, the Institute of Museum and Library Services, the United States Department of Energy through the National Energy Technology Laboratory, and the United States Army Corps of Engineers.
REFERENCES
Beaujardiere, Jeff de (editor), 2004, Web Map Service: Open Geospatial Consortium, Inc., OGC-04-024 version 1.3, accessed at http://portal.opengeospatial.org/files?artifact_id=5316.
Nielson, Jakob, 1999, Do Interface Standards Stifle Design Creativity?, accessed at http://www.useit.com/alertbox/990822.html.