
Digital Mapping Techniques '04— Workshop Proceedings
U.S. Geological Survey Open-File
Report 2004–1451
Photogrammetry Methods at the Utah Geological Survey: From Field Mapping to Published Map
Utah Geological Survey, 1594 W. North Temple, Salt Lake City, Utah 84116; Phone: (801) 537-3300; Fax: (801) 537-3400; e-mail: kentbrown@utah.govINTRODUCTION
Since 1991 the Geologic Mapping Program of the Utah Geological Survey (UGS) has used photogrammetry to produce geologic maps from field mapping drawn on aerial photographs. Since the science of geology is three-dimensional it makes sense to do mapping in 3-D. Photogrammetry can be defined as applying “the sciences of geometry, mathematics, and physics that use the photographic image of a 3-D scene on a 2-D piece of paper to reconstruct a reliable and accurate model of the original 3-D scene” (James R. Williamson, Ph.D., Photogrammetry website http://www.123photogrammetry.com/photogrammetry.html).
Traditional mapping methods involve duplication of work as the geology is hand drawn three or more times before the map is published: first on the aerial photographs in the field, then hand transferred to either a topographic base map or an orthophoto quad, then redrawn by the cartographer, either by hand or digitized. When using photogrammetry, the geologic map is compiled in stereo as a digital file and there is no longer a need for redrawing the map, thereby saving many hours of labor and reducing the potential for introducing errors. Other benefits include increased precision; ability to view orthographically corrected photographic images in 3-D, and precise software functions for calculating three-point problems.
There are three types of photogrammetric equipment: analog, analytical, and digital (softcopy). The analog type is entirely mechanical, the analytical type is a computer-controlled mechanical system with digital output, and the digital type is free of mechanical devices; it uses only a computer, 3-D glasses, and software.
In analog and analytical systems the aerial photographs are placed in the instrument and three orientations are performed to correct for lens distortion, Earth curvature, aircraft altitude changes between photos, aircraft orientation, changes in ground surface elevation between photos, etc. In a digital system the photographs are scanned and then the same three orientations are performed on the photographic images using software.
The UGS purchased an analytical system in 1991 and has used it in publishing more than 35 geologic maps. In May of 2003 we began using a digital system in which geologists digitize geologic map features directly on the on-screen 3-D photographic image. This paper describes the use of our analytical stereoplotter and our digital photogrammetry workstation and how we use them to compile geologic maps.
OVERVIEW OF METHODS
Any successful photogrammetry project begins with the acquisition of suitable aerial photographic coverage of the project area. The geologist then delineates geologic features on the photographs in the field.
Photogrammetry was developed to accurately reproduce the three-dimensional surface of the Earth from two-dimensional photographs. Pairs of overlapping aerial photographs, called stereo pairs, are required to achieve this. Typical image overlap between photographs is 60 percent.
Cameras designed for aerial photography must be precisely calibrated. In the United States, aerial cameras are calibrated by the United States Geological Survey (USGS), National Mapping Division. Camera calibration reports are made for each camera as certification of precision. This report is critical in the process of photogrammetric setups.
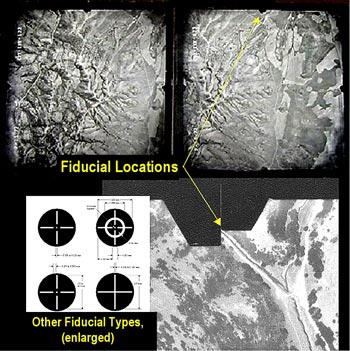
The film plane of each camera includes a set of four or eight reference marks known as fiducials (Figure 1). These fiducial marks are precisely measured positions in the exposure frame of each photograph. Fiducial marks are used to locate the position of the photograph in the stereoplotter. The fiducial measurements, along with the calibrated focal length of the lens, are included in the camera calibration report.
 |
 |
|
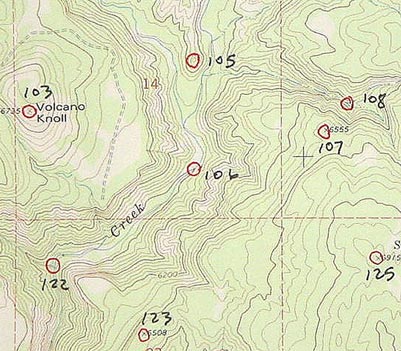
| Figure 1. Typical aerial camera fiducial marks. | Figure 2. USGS topographic map showing selected control point locations. |
In order to recreate the original Earth surface from the photography, three-dimensional ground control is required. Traditionally at the UGS, we prepared the ground control using the USGS 7.5-minute topographic maps (Figure 2). We viewed the stereo pair through a stereoscope and selected control points by correlating features that were visible on both the aerial photographs and the topographic map. We marked these control point positions on the topographic map and interpolated the point elevations from the contours. The x-y-z coordinates for the ground control points were established by digitizing them from the topographic map and manually entering the interpolated point elevations.
Currently we use a newer method of creating the ground control using a USGS digital orthophoto quadrangle (DOQ). A DOQ is a mosaic of photogrammetrically corrected photographic images that meets National Map Accuracy Standards for 1:24,000-scale mapping. Similar techniques of point selection are employed with this method; however, the points are placed on the DOQ (Figure 3) using ESRI ArcGIS software. This method extends the possibilities for control point locations since almost any point visible on the photograph can be used for control. Next, the x-y points are draped over a USGS 10-meter-resolution digital elevation model (DEM) from which the point elevations can be obtained. The x-y-z coordinates are then extracted and exported to a ground control file used by orientation software to establish real-world coordinates for the stereo model.
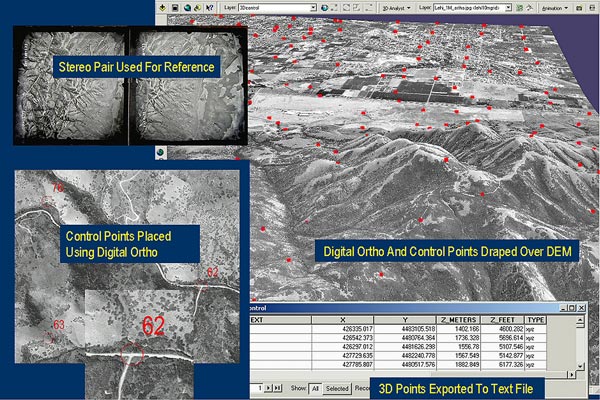 |
Figure 3. Suitable ground control is prepared by comparing the stereo pair to the digital orthophoto and then choosing correlative photo points. Points are placed on the digital orthophoto using ESRI ArcMap and saved as a shapefile. Using ESRI ArcScene, the points and digital orthophoto are draped over a 10-meter digital elevation model, from which the x, y, and z values of the points are calculated and added to matching fields in the shapefile table. |
Analytical Photogrammetry
In 1991, the UGS purchased an Alpha 2000 analytical stereoplotter (Figure 4) manufactured by International Imaging Systems, a now-defunct corporation. Analytical stereoplotters are computer-controlled instruments and most of them use an x-y-z motion device called a “puck” as a user interface. The photogrammetry software we use is VrOne by Cardinal Systems L.L.C.
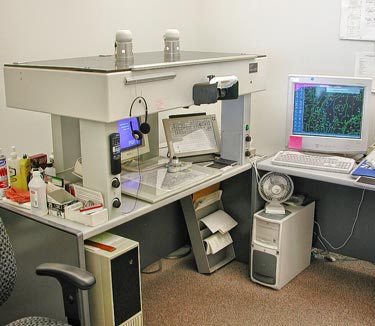 |
Figure 4. Alpha 2000 analytical stereoplotter. |
A pair of photographs properly set up in the stereoplotter is called a stereo model. To begin the setup, a stereo pair of photographs is placed between the glass plates of the instrument (Figure 5). The glass plates move independently in the x and y directions to maintain stereovision during model setups and map compilation. The photogrammetrist creates a stereo model by performing three critical orientations using the system software functions.
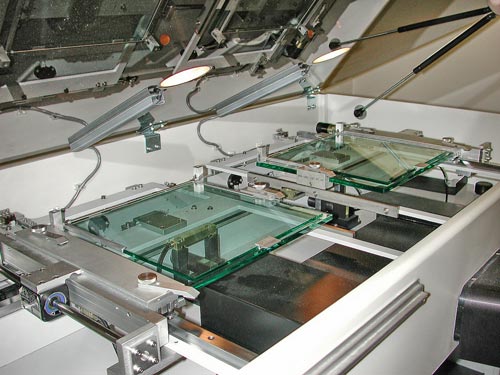 |
Figure 5. “Under the hood” showing the glass plates of the Alpha 2000. |
The first orientation is called “inner orientation” and is necessary to establish the position of the aerial photographs in relation to the glass plates. The positions of the glass plates in the stereoplotter have been calibrated to within 2 μm. Using the puck, each fiducial mark is measured by locating its x-y position and digitizing it. These positions are cross-referenced by the orientation software to the fiducial measurements in the camera data file. The camera data file is created using information from the camera calibration report.
The second orientation is called “relative orientation” and is performed to eliminate parallax in the stereo model. Parallax is defined as “the apparent displacement of an observed object due to a change in the position of the observer” (Random House Webster’s Electronic Dictionary and Thesaurus, College Edition, Version 1.0). It commonly occurs in a set of overlapping photos. Depending on the software, six or seven matching photo positions are measured (Figure 6) for each photo pair and the orientation software uses these positions to eliminate parallax and achieve stereovision.
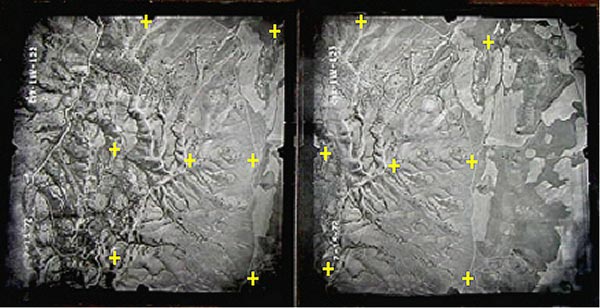 |
Figure 6. “Relative orientation” is done by selecting correlative photo points: this eliminates model parallax. |
The third orientation is called “absolute orientation.” In this step, the software accesses the ground control file and prompts the photogrammetrist to locate two ground control points within the stereo model area. After the first two points are located and digitized, the software searches the ground control file for points located within the dimensions of the stereo model and drives the glass plates of the stereoplotter to each of the remaining control point positions. These point positions are then digitized and the software triangulates between all control points. This step establishes three-dimensional geometry, and real-world coordinates are applied to the stereo model.
When all three orientations are completed the stereo model is ready for the geologist to compile geologic features delineated on the aerial photographs. The geologist views the stereo imagery through the binocular eyepiece. Both the left and right views show a small illuminated dot called a measuring mark, which represents the ground surface. The puck has a z-motion thumbwheel that, when rotated, shows the two measuring marks either converging or diverging until they appear to fuse, indicating that the x-y position is on the ground surface. Moving the puck, the geologist travels in the x and y directions to follow the geologic feature being compiled while adjusting the z position with the thumbwheel to keep the measuring marks converged on the ground surface. These motions are recorded as streams of x-y-z coordinates and are transferred to a computer hosting the VrOne photogrammetry software.
A valuable component of VrOne is a function designed to precisely calculate three-point problems. Using this function the geologist is able to map fault, bedding, and foliation planes more accurately, especially where exposures are poor, or in areas that are difficult or even impossible to reach in the field.
All x, y, and z motions are recorded as three-dimensional lines with each vertex carrying an x-y-z coordinate. In this manner all contacts, faults, fold axes, point data, symbols, and other geologic features are compiled (Figure 7). This compilation results in a georeferenced vector file that is imported into ArcGIS, where a Geographic Information System (GIS) database is created.
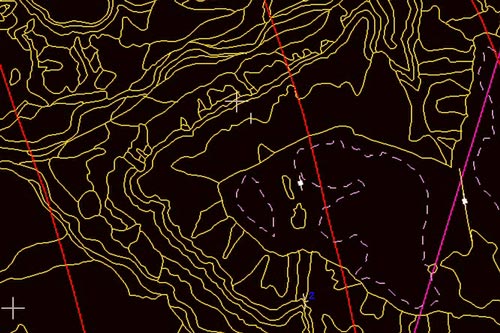 |
Figure 7. Screenshot showing geologic map created with VrOne photogrammetry software. |
Digital Photogrammetry
The digital, or soft copy, photogrammetry systems (Figure 8) are much simpler in design than the analytical systems; they consist of a computer with a stereo-capable graphics system, 3-D glasses with electronic shutters, and a “3-D mouse” as a user interface. The 3-D mouse is a reconfigured optical mouse with x, y, and z motion control and several user-configurable buttons. All other hardware of an analytical system has been replaced with software programming, alleviating the problems with mechanical devices wearing out or needing adjustments to stay within close tolerances. For digital photogrammetry, the UGS uses VrTwo software, also from Cardinal Systems L.L.C.
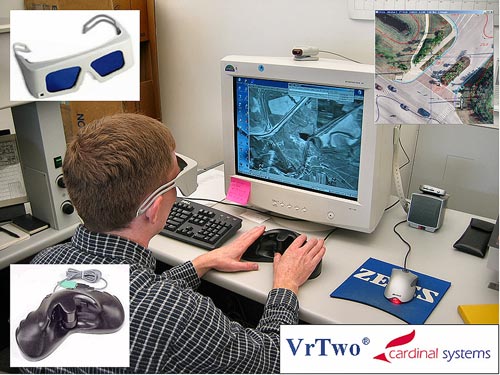 |
Figure 8. Digital or “soft copy” photogrammetry workstation using VrTwo software, showing stereo glasses and “3-D mouse”. |
Digital systems require that the aerial photographs be scanned as high-resolution images (1000+ dpi) that are then spatially corrected using the same three orientations described previously. During map compilation the photographic images are seen in 3-D on the screen using the special glasses, and all geologic features are drawn directly on this virtual ground surface using the 3-D mouse (Figure 9).
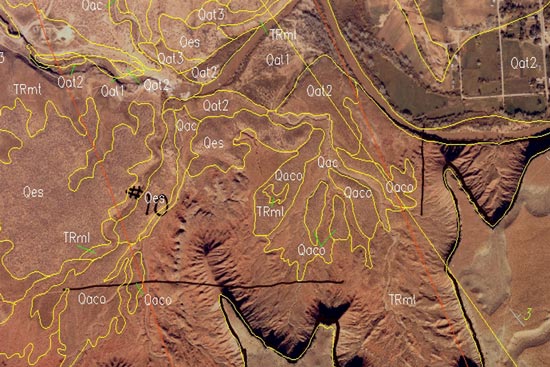 |
Figure 9. Screenshot showing geologic features digitized on the 3-D photographic surface in VrTwo software. This image is a simulation since true 3-D using VrTwo is not possible in this document. |
Digital systems also support the creation of digital terrain models (DTM’s) to enhance the mapping project. A DTM is an elevation model of the Earth’s surface derived from photogrammetry. Using a DTM, a triangular irregular network (TIN) can be created. From a TIN, digital orthophotos and automatically generated topographic contours can be produced.
PUBLISHING
UGS publishing methods are quite detailed so only a brief overview is given here. The completed geologic map compilation is exported as a series of drawing exchange format (DXF) files. DXF is an industry standard export format and the files are readable by virtually any mapping or publishing software. The DXF files are imported into ArcInfo and coverages are created. After further editing, these arcs are used to build polygon topology and then all arcs and polygons are attributed to show what type of geologic features they represent. The geologic map is then plotted on a large-format inkjet plotter for scientific review. After review comments are made and any corrections completed, the coverages are converted to shapefiles and are forwarded to our editorial group for publication.
The UGS editorial group employs two cartographers who use Illustrator, by Adobe Systems Inc., and MAPublisher, by Avenza Systems Inc., to import shapefiles and base map images. MAPublisher is designed as a set of plug-ins for Illustrator and will import georeferenced GIS data with full access to all feature attributes. The cartographers can select geologic features from the attribute tables and then use the publishing tools of the Illustrator software to create the final geologic map layout. Illustrator is also used to create the map explanation sheet. At this stage the maps can be converted to Adobe portable document format (PDF) or MrSID (LizardTech Inc.) image files for distribution over the Internet, or inkjet plots are made for distribution to libraries and to be sold in the Utah Department of Natural Resources bookstore. Some UGS geologic maps are sent as Adobe Illustrator files to a printing company for high-quality offset printing. Graphically, offset printing yields a superior paper copy with a longer useful lifetime than the inkjet plot and remains the UGS’s preferred method of publishing paper maps.
CONCLUSIONS
The use of photogrammetry for geologic mapping has benefited the UGS mapping program in many ways. These techniques have resulted in a much higher level of detail and precision than can be achieved with other methods. Using software designed for precise calculation of three-point problems, geologists can map or measure fault, bedding, and foliation planes more accurately, especially where exposures are poor or in areas that are difficult to reach in the field. Our geologic maps are compiled in stereo as digital files and using photogrammetry and ArcGIS nearly eliminates most duplication of effort. No longer do geologists redraw the map several times, thereby saving many hours of labor and reducing the potential of introducing errors.
SUGGESTED READING
Avery, E. T., 1968, Interpretation of Aerial Photographs, Second Edition: Burgess Publishing Company, 324 p.
McGlone, Chris, editor, 2004, Manual of Photogrammetry, Fifth Edition: American Society of Photogrammetry, 1168 p.
Raisz, Erwin, 1962, Principles of Cartography: McGraw-Hill, 315 p.
HARDWARE AND SOFTWARE VENDORS
Adobe Systems Inc., 345 Park Ave., San Jose, California 95110-2704, accessed at http://www.adobe.com/.
Avenza Systems Inc., 124 Merton St., Suite 400, Toronto, Ontario, CANADA M4S 2Z2, accessed at http://www.avenza.com/.
Cardinal Systems L.L.C., 175 Lehigh Avenue, Flagler Beach, FL 32136 USA, (386) 439-2525, Fax: (386) 439-1553, Email: mike@cardinalsystems.net, accessed at http://www.cardinalsystems.net/.
ESRI, 380 New York St., Redlands, CA 92373-8100 USA, (909) 793-2853, Fax: (909) 793-5953, Email: info@esri.com, accessed at http://www.esri.com/.
LizardTech, The National Building, Suite 200, 1008 Western Ave., Seattle, WA 98104, (206) 652-5211, Fax: (206) 652-0880, accessed at http://www.lizardtech.com/.