
Digital Mapping Techniques '04— Workshop Proceedings
U.S. Geological Survey Open-File
Report 2004–1451
Investigating the San Simeon Earthquake Using ArcPad and GPS
San Luis Obispo County Planning and Building Department, County Government Center, San Luis Obispo, CA 93408; Telephone: (805) 781-4577; Fax: (805) 788-2413; e-mail: Lrosenberg@co.slo.ca.usINTRODUCTION
The December 22, 2003, Magnitude 6.5 (M6.5) San Simeon, CA, earthquake provided a unique opportunity to use mobile digital mapping techniques to rapidly and effectively investigate the effects of the earthquake. This was accomplished by using a combination of mobile Geographic Information System (GIS) software (specifically, ESRI ArcPad) and global positioning system (GPS) technology on a handheld computer, or Personal Digital Assistant (PDA). This approach improved upon traditional techniques of disaster assessment and geologic field mapping, and resulted in a detailed, accurate database of earthquake effects and damage. This database has proven useful for a variety of needs including scientific investigations, building department permitting, and presenting information to decision-makers in the public sector. Thus, the combination of ArcPad and GPS will likely become a widely used tool for damage assessment in future earthquakes.
THE NEED FOR MOBILE GIS IN ASSESSING THE SAN SIMEON EARTHQUAKE
On December 22, 2003, a M6.5 earthquake struck the central coast of California, with the epicenter near the community of San Simeon (Figure 1). The San Simeon earthquake produced a large amount of damage, including collapse of unreinforced masonry buildings, ground cracking, widespread landslides, liquefaction, and changes to the flow from springs and water wells. The affected area extended in a southeastern direction from the epicenter, with significant damage as far as 80 km away. The estimated damage was approximately $239 million (Kircher & Associates, 2004).
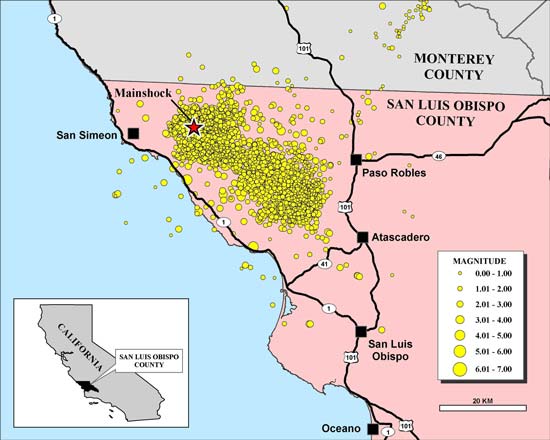 |
Figure 1. Location map of San Luis Obispo County, showing San Simeon earthquake epicenter (labeled “Mainshock”) and aftershocks (indicated by yellow circles). |
Because the earthquake happened only a few days before Christmas, many people were on vacation. This resulted in a shortage of personnel available to assess earthquake damage. The State of California Governor’s Office of Emergency Services elected not to set up a data clearinghouse for the San Simeon earthquake. Therefore, there was a great need to acquire in a timely manner information about the effects of the earthquake, for use by county officials and the geologic community. Faced with this task, as the San Luis Obispo County Planning and Building Department (SLOCPBD) County Geologist, I used mobile GIS/GPS to collect data about earthquake damage and effects. The combination of ArcPad and GPS was ideal for this task and enabled me to share data with other local, state, and federal agencies through an informal, Web-based county data clearinghouse, which I set up a few days after the earthquake.
EQUIPMENT NEEDED FOR EARTHQUAKE ASSESSMENT
For a mobile GIS that can be used for assessing earthquake damage, the basic components are fairly simple: a PDA, a GPS, and a copy of ArcPad. Edmundo (2002) presented a comprehensive review of the various types of PDA and GPS hardware available at that time and the reader is referred to that article for more detailed information. The following section outlines the typical items used for earthquake damage assessment.
Hardware
The basic requirement is a PDA with the Microsoft Pocket PC operating system. Most business-type PDAs have sufficient computing power and memory to operate ArcPad. Also, sub-meter precision and ruggedized hand-held computers are becoming more common. Screen visibility under a variety of lighting conditions is an important issue with any computer. Optional features that prove useful are memory card slots and wireless capabilities, such as wireless Local Area Network (WLAN, also known as “Wi-Fi”). Depending on the type of system, the GPS can connect to the PDA via a storage card slot, or as a separate unit connected by cable. Storage cards facilitate carrying large amounts of data such as topographic maps. In the San Simeon example, a 512MB storage card contained the assessor parcel database, several scanned large-format geologic maps, a digitized streets database, and vectorized geologic maps for all of San Luis Obispo County, an area of nearly 8,600 km2.
Alternatively, a tablet or laptop computer running Windows 2000 or XP software and ESRI ArcView connected to a GPS could be used for collecting data. The advantage of the tablet or laptop computer is the enhanced capability of the ArcView software, while the disadvantages are reduced portability, ease of damage, and increased cost.
Although there are many different GPS units available, I prefer the Garmin 12XL because of its relatively low cost (about $300 in 2004), ruggedness, availability, long battery life (24 hours) and AA battery power supply. The observed horizontal accuracy of this unit is about 5–10 m, which is acceptable for reconnaissance-level hazard mapping. Units such as the Trimble GeoXM have greater horizontal accuracy (2–5 m), but are more costly (about $2,800 in 2004).
Software
The minimum software requirement is a copy of ArcPad, which is the mobile, reduced-capability version of desktop GIS programs such as ArcView or ArcInfo. ArcPad allows the user to collect new data and to have the capability of displaying the data along with georeferenced photographs, maps, and vector files such as parcels and roads. For more advanced users, ArcPad Application Builder is helpful in creating and customizing ArcPad forms. However, ArcPad Application Builder is not included with ArcPad and it has a steep learning curve, so there are significant cost and training issues associated with it.
By means of automated data analysis from seismograph stations, California Integrated Seismic Network (CISN) posts on their ShakeMap website (http://earthquake.usgs.gov/shakemap/) various ground motion values; this is done shortly after the earthquake occurs. These ground motions are available for download as either contoured polygons in ESRI Shapefile format or as raw grid (x,y,z) text files. These files are useful for initial estimates of where the strongest shaking and greatest damage are located, which is critical for emergency first-responders. At this time, only California, the Pacific Northwest, and the Salt Lake City, Utah areas have ShakeMap websites.
TECHNIQUES FOR MOBILE EARTHQUAKE DAMAGE ASSESSMENT
The techniques described in this section are intended for earthquake damage assessment. However, with minor modification, many of these techniques could be used for other types of natural disaster assessment such as landslides, flooding, or tornadoes.
Air Reconnaissance
Although not all mappers will have the opportunity to use helicopters or airplanes for earthquake damage assessment, it is one of the best ways to quickly cover a large area. By adding ArcPad and GPS, air reconnaissance becomes even more valuable. Here, I present a case study on how air reconnaissance combined with ArcPad and GPS were used in the San Simeon earthquake, along with lessons learned and issues that need to be resolved.
Following the earthquake, geologists from the USGS (John Tinsley and Kevin Schmidt) and the SLOCPBD (Lewis Rosenberg) flew by helicopter to the earthquake epicenter. We navigated to the epicenter using a Garmin 12XL GPS connected to a Hewlett-Packard Jornada 568 PDA running ArcPad version 6.03, supplemented by two Garmin GPS III GPS units. The epicenter location was downloaded from the USGS ShakeMap website (California Integrated Seismic Network, 2004) into ArcPad, and the GPS was used to guide the helicopter (Figure 2). We circled in order to get a feel for the level of detail we could and could not observe at a given elevation. Then, flying as low as the pilot liked, we circled about the epicenter at radial distances increasing at 3-km increments, at roughly 150 m above the terrain. Our goal was to search for fault rupture, landslides, and building damage. ArcPad allows the user to store the flight path, which can be superimposed on simulated terrain by means of a digital elevation model (Figure 3). This mode of presentation was useful to show other scientists and non-technical audiences the area covered in the initial air reconnaissance.
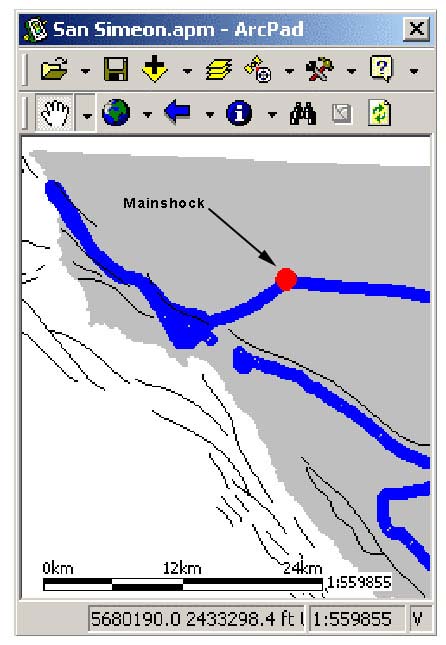 |
Figure 2. Screenshot of helicopter flight path (thick blue lines), faults (thin black lines), and mainshock epicenter. |
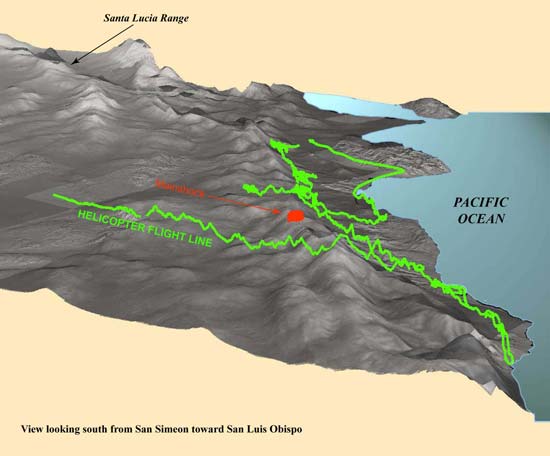 |
Figure 3. Oblique view of digital elevation model showing helicopter flight path on return to Paso Robles and earthquake mainshock. |
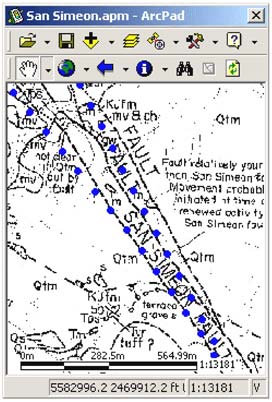
After circling the epicenter out to about 6–8 km radii, we then flew southeast along the mapped trace of the San Simeon fault. In places, this fault is relatively easy to follow from the air, as it is a contact between distinctive rocks (Monterey Formation shale and Franciscan Complex mélange) with a break in slope and change in lithology denoting the different units. In other areas, the fault is concealed beneath marine terrace deposits. ArcPad and GPS were extremely useful in these areas where the fault was concealed, owing to the ability to navigate in real time using a scanned, georeferenced geologic map (Figure 4).
 |
 |
|
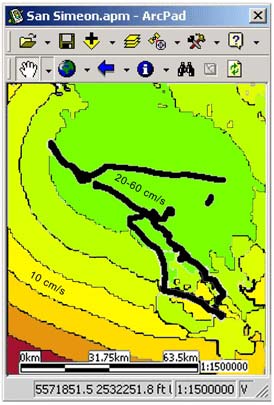
| Figure 4. Screenshot of helicopter flight path (dotted lines) and scanned geologic map (Hall, 1974) showing San Simeon fault. | Figure 5. Screenshot of helicopter flight path and ShakeMap peak ground velocities (greener color indicates relatively higher velocity). |
One of the lessons learned in studying California earthquakes is that seismically triggered rockfalls and landslides correlate with areas of high peak ground velocity (McCrink and Wilson, 2004). By loading into ArcPad the Shapefiles of peak ground velocity obtained from the ShakeMap website, we were able to explore the areas most likely to have landslides (Figure 5). This approach worked well—we noted numerous rockfalls and sheared and uprooted oak trees in areas of high peak ground velocity (30–40 cm/s) compared with other areas. These features suggested that the actual ground shaking was stronger than indicated by the initial automated ground motion reports.
We also used ArcPad and digital cameras to record damage, by creating point features linked to photographs of some of the more heavily damaged homes and roads in the foothills southwest of Paso Robles. This enabled us to find damage in a densely vegetated area with few roads, a task that would have been much less successful by ground-based methods. However, one problem was the issue of accuracy and precision owing to taking measurements in a moving aircraft. The airspeed of the helicopter was as much as 130–145 km per hour, with slower airspeeds where we were circling to evaluate observations made at higher rates of airspeed. We tried to account for this by each of us taking independent GPS readings for each point recorded. Although this approach offered the prospect of increasing the precision, it also complicates data reduction.
We anticipate that by using the photos we took, in relation to the trackline data, we can sort out and eventually report the best locations for observed features. We do not have a GPS location for each photo, as the camera shutter cycles much more quickly than does the waypoint acquisition function in the Garmin unit, but hopefully we acquired enough control to fit the photos into the terrain with some reliability. Regardless, the precision of GPS locations relative to observed features in the terrain will vary, because during the time we logged a given waypoint our helicopter’s elevation would vary. In addition, the azimuth of the helicopter changes with each photograph taken or waypoint reading. It would seem to be helpful to have the helicopter’s azimuth logged as a function of time, to help restrict the camera’s possible orientations while locating features photographed from the air. This could be accomplished by incorporating the bearing (“BRG”) field that corresponds to compass direction and is calculated by ArcPad.
As a general comparison with ground accuracy, we observed from the helicopter a prominent headscarp to a deep-seated landslide located on a hill near Paso Robles. The landowner had independently reported the fissure to me, and I subsequently located the headscarp on the ground using the Garmin GPS. This comparison showed that our helicopter GPS location was within 150 m of ground location. It is encouraging that our airborne-determined GPS locations may be close enough to be considered useful.
Ground Reconnaissance
Ground reconnaissance is the most commonly used technique for earthquake damage assessment. One of the useful features about using ArcPad and GPS is that sites can easily be located where street addressing is poor or non-existent. This is accomplished by having street map files such as U.S. Census “TIGER” files, or even better, having digital assessor parcel maps (Figure 6). For homeowners who do not work at home, this capability is essential; with digital parcel maps and cell phones, we were able to instantly contact landowners for permission to trespass on their land.
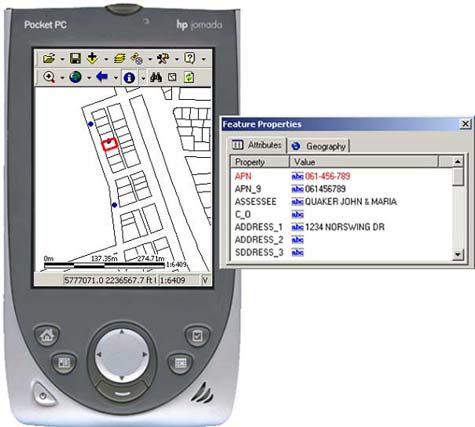 |
Figure 6. Screenshot of county parcel map and liquefaction sites (blue dots) located with GPS. |
Another purpose of ground reconnaissance is to map ground cracks. Although the typical horizontal precision of a recreational-grade GPS such as the Garmin 12XL is only 5 m, it is sufficient for reconnaissance-level mapping in rural areas, especially if a high-resolution aerial photograph is available for ground truthing (Figure 7).
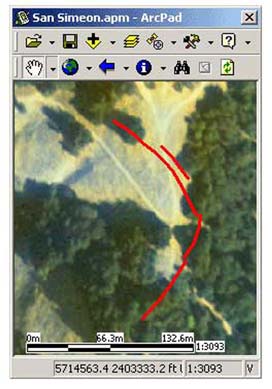 |
Figure 7. Screenshot of aerial photograph and landslide scarps (shown by the red lines) located with GPS. |
Public Relations
Although public relations are rarely presented as a topic in disaster assessment papers, it is a key issue in dealing with the public, especially following earthquakes. Landowners were much more receptive to allowing geologists to map their land once they were given a color aerial photograph of their property. Mobile GIS/GPS makes this a simple task if a color printer is available.
SOME IMPORTANT ISSUES
Although ArcPad and GPS are extremely useful for earthquake damage assessment, there are significant advantages and disadvantages associated with this approach. These are summarized below.
Advantages
Disadvantages
CONCLUSIONS
Our method of using ArcPad and GPS allowed us to acquire data effectively and quickly. It is a significant improvement to the technique of “pen and paper” mapping used in previous earthquakes. The widely used Shapefile format enables exchange of data inside and outside of the agency collecting the data.
For maximum effectiveness in hazards mapping, the equipment must be available in advance, and an event response plan must be in place. Although it is possible to learn basic proficiency with ArcPad in a short time, training individuals before the earthquake event allows them to focus on damage assessment during a time when every minute counts.
There are significant cost and training issues for acquiring the hardware and software. However, ArcPad and GPS can be used for routine, non-emergency applications such as building code enforcement, so the equipment is not for emergencies only.
ACKNOWLEDGMENTS
Because the San Simeon earthquake was an unplanned event, many of the techniques described in this paper were developed in the days following the earthquake. Thanks go to my co-workers J.C. Tinsley, III and K.M. Schmidt (USGS); T.P. McCrink, R.C. Loyd, and K.L. Knudsen (California Geological Survey), and M.J. Johnsson (California Coastal Commission) for taking the time to spend long days in the air and field during the holiday season—their help and insight were invaluable. Parts of Tinsley’s and Schmidt’s helicopter report were used in this paper. John Kelly (SLOCPBD Supervising Mapping Systems Specialist) is commended for his foresight in placing San Luis Obispo County’s GIS data on the Internet so that other workers could independently get the base map files they needed to perform their work.
REFERENCES
California Integrated Seismic Network, 2004, ShakeMap Home Page, accessed at http://earthquake.usgs.gov/shakemap/nc/shake/index.html.
Edmundo, G.P., 2002, Digital geologic field mapping using ArcPad, in Soller, D.R., ed., Digital mapping techniques ’02—workshop proceedings: U.S. Geological Survey Open-File Report 02–370, p. 129–134, accessed at http://pubs.usgs.gov/of/2002/of02-370/edmondo.html.
Hall, C.A., 1974, Geologic map of the Cambria region, San Luis Obispo County, California: U.S. Geological Survey Miscellaneous Field Studies Map MF–599, 2 sheets, scale 1:24,000.
Kircher & Associates, Consulting Engineers, 2004, M6.5 San Simeon earthquake—December 22, 2003, comparison of HAZUS99-SR2 estimates and observed damage and losses: unpublished report dated March 29, 2004, 5 p, accessed at http://www.hazus.org/BAHUG/BAHUG%20Documents/KIRCHER_San_Simeon_Analysis.pdf.
McCrink, Timothy, and Wilson, Rick, 2004, Summary of Seismic Hazards Mapping Program post earthquake field activities following the magnitude 6.5 San Simeon earthquake of December 22, 2003: Part 1—Summary of reconnaisance field activities and observations: California Geological Survey, Seismic Hazard Mapping Program, Technical Document 2004–1, 44 p.
VENDOR CONTACT INFORMATION
ESRI ArcInfo, ArcPad, ArcPad Application Builder, ArcView—Environmental Systems Research Institute (ESRI), Inc., 380 New York St., Redlands, CA 92373-8100 USA, (909) 793-2853, accessed at http://www.esri.com/.
Garmin 12XL—Garmin International Inc. 1200 East 151st St., Olathe, KS 66062 USA, (913) 397-8200, accessed at http://www.garmin.com/.
HP Jornada 568—Hewlett-Packard Development Co., L.P., 3000 Hanover St., Palo Alto, CA 94304-1185 USA, (650) 857-1501, accessed at http://www.hp.com/.
Microsoft Pocket PC, Windows 2000, Windows XP—Microsoft Corp., One Microsoft Way, Redmond, WA 98052-6399 USA, (425) 882-8080, accessed at http://www.microsoft.com/.
Trimble GeoXM—Trimble Navigation Limited, 749 North Mary Ave., Sunnyvale, CA 94085 USA, (408) 481-8000, accessed at http://www.trimble.com/.