The surveys were flown mostly in east-west flight lines, spaced from 0.125 to 3.0 miles apart, with elevations ranging from 400 ft to 1000 ft above ground in the drape mode and 5000 ft above sea level in the constant barometric elevation mode. Surveys flown at elevations other than the target elevation were mathematically continued to the target elevation. About half of the state was flown at a line spacing of 0.5 mile or smaller.
All surveys have been continued to 152.4 meters (500 feet) above ground and then blended or merged together. The entire state grid was then continued upward to 304.8 meters (1000 feet) above ground. Grids at both elevations are available in several formats.
This Virginia aeromagnetic compilation is one part of a national digital compilation by the U.S. Geological Survey, where the standard selected for this national compilation is a survey elevation of 304.8 m (1000 feet) above mean terrain. Other state compilations can be found online at: <http://crustal.usgs.gov/geophysics/state.html>
Also included on this web page is a statewide compilation of gravity data. The gravity data consist of prior publicly available data, and is presented here both in point format and as a grid, with a grid spacing of 2.0 km.
Snyder, Stephen L. , 2005, Virginia Aeromagnetic and Gravity Maps and Data: A Web Site for Distribution of Data: U.S. Geological Survey Open-File Report 2005-1052, U.S. Geological Survey, Reston, Virginia, USA.Online Links:
This is a raster data set. It contains the following raster data types:
The map projection used is Lambert Conformal Conic.
Planar coordinates are encoded using row and column
Abscissae (x-coordinates) are specified to the nearest 0.5
Ordinates (y-coordinates) are specified to the nearest 0.5
Planar coordinates are specified in km
The horizontal datum used is North American Datum of 1927.
The ellipsoid used is Clarke 1866.
The semi-major axis of the ellipsoid used is 6378206.4.
The flattening of the ellipsoid used is 1/1/294.98.
1) vamag_1000ft.grd - The aeromagnetic data as observed at 1000 ft. above ground. 2) vamag_500ft.grd - The aeromagnetic data as observed at 500 ft. above ground. 3) vagrav.grd - The complete Bouguer gravity anomaly. Each grid has been compressed and is available as a self-extracting executable file. The grids are in Geosoft Oasis-Montaj binary grid format (*.grd) and each has an accompanying file with the suffix .gi that contains the projection information. The grid spacing of the aeromagnetic grids is 0.5 km and the grid spacing of the gravity grid is 2.0 km.
Three alternate formats, produced from the Geosoft grids, are supplied for each of the primary grids. The three alternate formats are: 1) Grid Exchange Format - an ASCII grid transfer format (file type .GXF) 2) USGS a binary - USGS PC format (binary format - file types *.usg and *.usg.gi) 3) ESRI Spatial Analyst (file type *.ARC) - a binary format consisting of a *.flt and a *.hdr file.
The individual magnetic surveys were continued from their original flight elevation surfaces to a draped surface 500 ft above the terrain and merged together. The final merged grid was then continued to a draped surface 1,000 feet above terrain. The grid spacing of the final merged grid is 0.5 km.
(Source: A description of magnetometers and gravity meters and how they measure the total magnetic field or the acceleration due to gravity can be found in Blakely, R.J., 1994, Potential theory in gravity and magnetic applications: Cambridge University Press, New York, 441 p. See also: Phillips, J.D., 1997, Potential-field geophysical software for the PC, version 2.2: U.S. Geological Survey Open File Report 97-725, online at: <http://pubs.usgs.gov/of/1997/ofr-97-0725/pfofr.htm>. See fact sheet: <http://pubs.usgs.gov/fs/fs-0236-95/fs-0236-95.pdf> )
| Value | Definition |
|---|---|
| -1e+32 | dummy value; area of no data |
| Range of values | |
|---|---|
| Minimum: | -835.38 |
| Maximum: | 3287.54 |
| Units: | nanoteslas (nT) |
The individual magnetic surveys were continued from their original flight elevation surfaces to a draped surface 500 ft above the terrain. The grid spacing of the final merged grid is 0.5 km.
(Source: A description of magnetometers and gravity meters and how they measure the total magnetic field or the acceleration due to gravity can be found in Blakely, R.J., 1994, Potential theory in gravity and magnetic applications: Cambridge University Press, New York, 441 p. See also: Phillips, J.D., 1997, Potential-field geophysical software for the PC, version 2.2: U.S. Geological Survey Open File Report 97-725, online at: <http://pubs.usgs.gov/of/1997/ofr-97-0725/pfofr.htm>. See fact sheet: <http://pubs.usgs.gov/fs/fs-0236-95/fs-0236-95.pdf> )
| Value | Definition |
|---|---|
| -1e+32 | dummy value; area of no data |
| Range of values | |
|---|---|
| Minimum: | -1053.77 |
| Maximum: | 4226.11 |
| Units: | nanoteslas (nT) |
(Source: See: Nettleton, L.L., 1971, Elementary Gravity and Magnetics for Geologists and Seismologists: Society of Exploration Geophysicists Monograph Series No. 1. See fact sheet: <http://pubs.usgs.gov/fs/fs-0239-95/fs-0239-95.pdf>)
| Value | Definition |
|---|---|
| -1e+32 | dummy value; area of no data |
| Range of values | |
|---|---|
| Minimum: | -100.45 |
| Maximum: | 42.44 |
| Units: | milliGals (mGal) |
| Range of values | |
|---|---|
| Minimum: | -83.66 |
| Maximum: | -75.31 |
| Units: | decimal degrees |
| Resolution: | 0.00001 |
| Range of values | |
|---|---|
| Minimum: | 36.54 |
| Maximum: | 39.43 |
| Units: | decimal degrees |
| Resolution: | 0.00001 |
| Range of values | |
|---|---|
| Minimum: | -50.02 |
| Maximum: | 77.30 |
| Units: | milliGals (mGal) |
| Resolution: | 0.01 |
| Range of values | |
|---|---|
| Minimum: | -101.02 |
| Maximum: | 43.51 |
| Units: | milliGals (mGal) |
| Resolution: | 0.01 |
| Range of values | |
|---|---|
| Minimum: | 0.0 |
| Maximum: | 4409.0 |
| Units: | feet |
| Resolution: | 0.1 |
| Range of values | |
|---|---|
| Minimum: | 0.0 |
| Maximum: | 0.0 |
| Units: | milliGals (mGal) |
| Resolution: | 0.01 |
| Range of values | |
|---|---|
| Minimum: | -0.11 |
| Maximum: | 21.35 |
| Units: | milliGals (mGal) |
| Resolution: | 0.01 |
| Range of values | |
|---|---|
| Minimum: | 979554.20 |
| Maximum: | 980113.81 |
| Units: | milliGals (mGal) |
| Resolution: | 0.01 |
| Range of values | |
|---|---|
| Minimum: | 1 |
| Maximum: | 93004 |
| Units: | none |
| Resolution: | 1 |
Stephen L. Snyder
703-648-6384 (voice)
ssnyder@usgs.gov
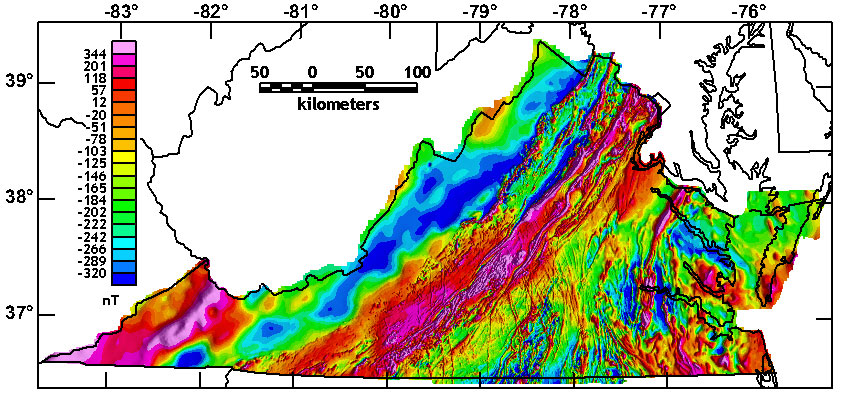
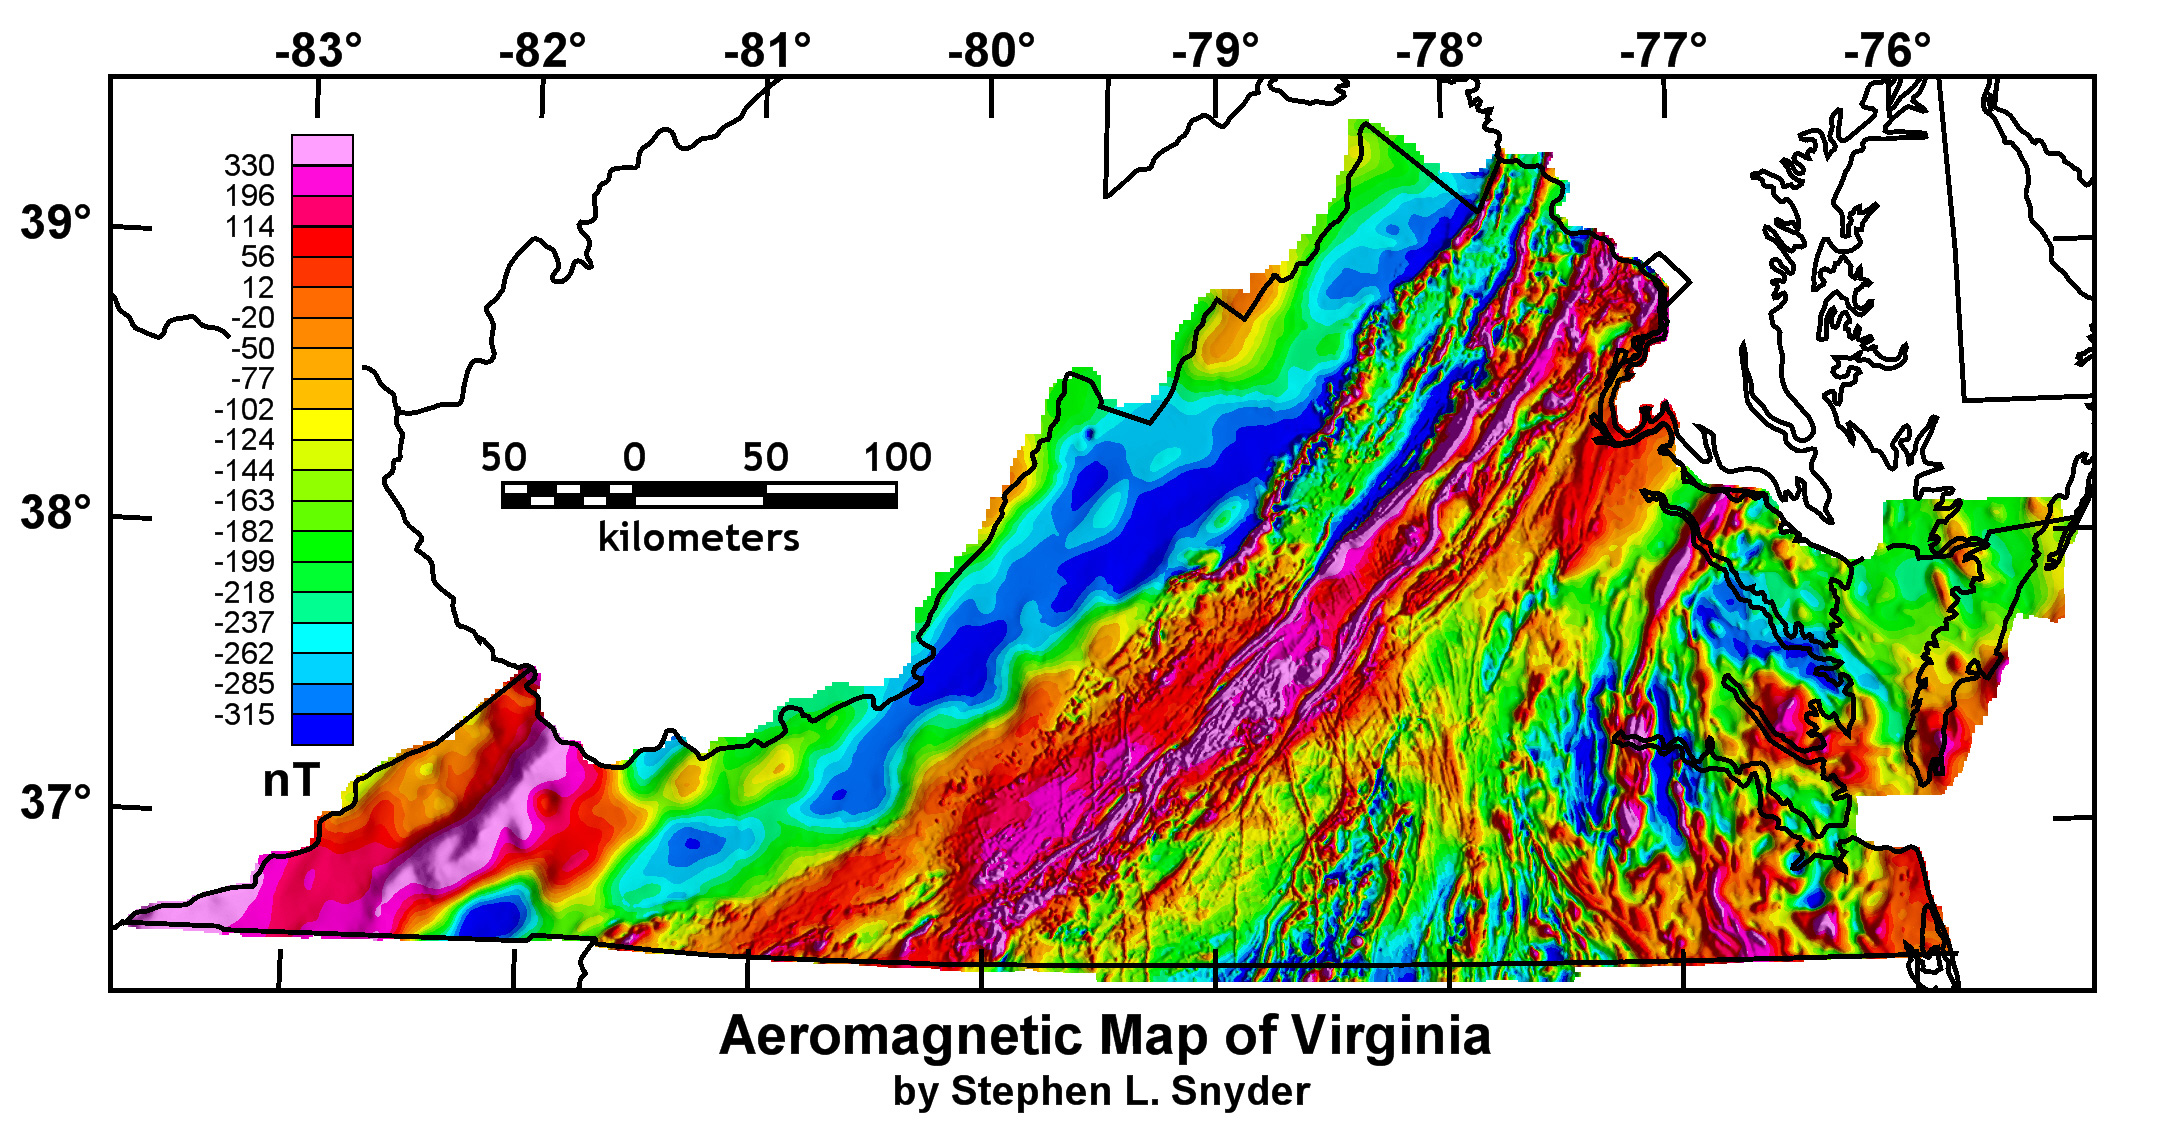
Presentation of gridded aeromagnetic data values display aeromagnetic anomalies used in geological and geophysical studies. Aeromagnetic anomalies are due to variations in the Earth's magnetic field caused by the uneven distribution of magnetic minerals (primarily magnetite) in the rocks that make up the upper part of the Earth's crust. The features and patterns of the aeromagnetic anomalies can be used to delineate details of subsurface geology including the locations of buried faults, magnetite-bearing rocks, and the thickness of surficial sedimentary rocks (which are generally non-magnetic). This information is valuable for mineral exploration, geologic mapping, and environmental studies.
23 individual aeromagnetic surveys were used to create the Virginia state-wide compilation. Descriptions of the data acquisition procedures are contained in the map information page in open-file report <http://pubs.usgs.gov/of/2005/1052>
Grids were constructed from the original aeromagnetic survey data with a cell size of between 1/3 and 1/5 of the flightline spacing of the survey, using a minimum curvature gridding algorithm. For digitized contour line data, the initial grid was constructed using a minimum curvature algorithm and a spacing appropriate for the scale of the digitized map.
The Definitive Geomagnetic Reference Field (DGRF calculated for the date of the original survey was removed (in some cases this required the determination and addition of the original reference field removed before removal of the DGRF).
The original survey grids were continued to 152.4 meters (500 feet) above ground by draping as necessary. Upward continuation of the digitized draped surveys was by standard 2D FFT filtering techniques. Level-to-drape continuation, was performed using equivalent source techniques.
The survey grids were regridded, as necessary, to the final grid cell size of 0.5 km using a minimum curvature algorithm.
The datum levels of the converted grids were adjusted (by addition or subtraction of a constant value) to minimize differences at the boundaries.
These adjusted grids were combined into a single merged grid that shows the magnetic field measured or calculated at 152.4 meters (500 feet) above ground. Then the entire merged grid was continued upward to the final elevation of 304.8 meters (1000 feet) above ground.
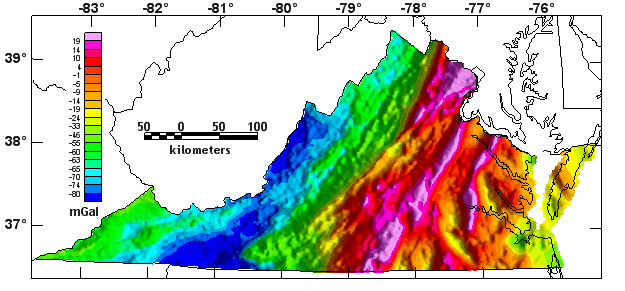
Gravity Data:
The complete-Bouguer gravity anomaly grid was compiled using data from 29,488 gravity stations from 65 separate sources in the state of Virginia. These data were extracted from the Gravity 1999 edition CD-ROM issued by the National Geophysical Data Center (NGDC). Of the 29,488 gravity stations within the state of Virginia, approximately 18,200 were provided by the Virginia Division of Mineral Resources (VDMR).
Observed gravity relative to the IGSN-71 datum were reduced to the Bouguer anomaly using the 1967 gravity formula (Cordell and others, 1982) and a reduction density of 2.67 g/cm3. Outer-zone terrain corrections for 0.895 km (Hammer zone G) to 166.7 km from each station were computed using the computer algorithm of Godson and Plouff (1988). A digital elevation model with a 15 arc-second sample interval (digitized from USGS 1:250,000 scale topographic maps) was used closest to the station. No inner-zone terrain corrections (Hammer zones A-F) nor hand terrain corrections were made for the data in this report. The data were converted to a 2-km grid using minimum curvature techniques and are displayed with an illumination from the east.
David Dater, Dan Metzger, and Allen Hittelman (c, 1999, Land and Marine Gravity CD-ROMs, 1999.: U.S. Department of Commerce, National Oceanic and Atmospheric Administration, National Geophysical Data Center, Boulder, CO.Online Links:
Grid values of aeromagnetic anomaly represent the total intensity of the Earth's magnetic field interpolated into an array and after removal of the International Geomagnetic Reference Field (IGRF). Measurements were made using a variety of magnetometer systems with typical accuracies of 0.5 to 10 nanotesla (nT).
The magnetic grids presented in this report were made from 23 individual aeromagnetic survey grids that were mathematically stitched together using standard techniques. Individual metadata files exist for USGS gridded data created from digital flight-line data (see USGS Open-File Report 02-0361) <http://pubs.usgs.gov/of/2002/ofr-02-361/>.
The magnetic data in the original grids have been processed using formulas and methods that are not usually documented but that represent industry standard practices for airborne data reduction. A final grid interval of 0.5 km was chosen as representative.
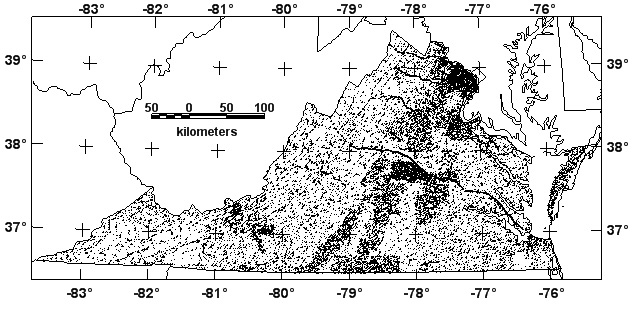
Grid values of gravity anomaly represent gravity measurments at thousands of ground stations chosen for their known elevations. Measurements are relative to base stations that are tied to an international network of known gravity acceleration. Industry standard reduction formulae convert the field measurements to Bouguer anomaly values. Corrections for terrain are made using a digital elevation model. The random station measurements are interpolated into a regular grid of 2.0 km spacing.
Aeromagnetic Surveys:
Flight Path Recovery - before about 1975 horizontal position of the survey aircraft used to collect data were determined by reconciling downward-looking photographs (recorded on continuous-strip film) with topographic maps and orthophotoquadrangle maps. Fiducial numbers and marks, impressed on any paper strips that were recording data or added to magnetic tape records, were included as a function of time to further reconcile location with instrumentation.
Flight Path Recovery - before about 1990 Horizontal position of the survey aircraft used to collect data were determined using aircraft navigational aids such as line-of-sight electronic systems that measure the distances from each of two ground stations to the aircraft using microwave or radio transmitters.
Flight Path Recovery - after about 1990 horizontal position of the survey aircraft used to collect data were determined using GPS satellite navigation.
Gravity Surveys:
Station position recovery - before about 1990 the horizontal position of the station was determined from 1:24,000 topographic maps by digitizing the location of the estimated station position.
Station position recovery - after about 1990 the horizontal position of the station was determined by means of a handheld GPS instrument.
Aeromagnetic Surveys
The aircraft vertical position was determined using the navigational positioning equipment on the aircraft, which were radar altimeter and barometric altimeter. Radar altimeters are estimated to have an error of 2-5% of the altitude (Richard Hansen, PRJ, Inc., written communication).
Barometric altimeters are quite accurate, but are typically operated in an uncorrected mode. The diurnal variation in air pressure over the course of a flight can produce a 50-100 ft error in the barometric altimeter reading. In addition, pressure microcells create short-period air pressure changes equivalent to about 10 ft under typical conditions (Richard Hansen, PRJ, Inc., written communication)
The magnetometer was carried on a "stinger" that was attached to the aircraft or was carried in a "bird" towed on a cable that was below the aircraft. The bird, as it is towed, is slightly behind the aircraft and therefore the vertical distance between the magnetometer and the aircraft is slightly less than the length of the line but remains constant for the survey.
Data were either collected at a fixed barometric altitude or were collected as a draped survey having an average terrain clearance above the ground. Because aircraft, especially airplanes, cannot safely maintain a constant terrain clearance, the actual height above ground varies widely depending on the roughness of the terrain.
Gravity surveys
The station elevation is referred to either a monumented mark such as (1) a bench mark, (2) a "useful elevation" mark, or (3) a non-monumented "spot elevation", at road intersections, all of which appear on a 1:24,000-scale USGS topographic map. The first two are established by ground surveying techniques. The third, spot elevations, are determined by photogrammetric methods from aerial photographs. Other elevations of lesser accuracy may be used less frequently such as lake water level, where known, barometric altimeter measurements, and elevations interpolated from topographic contours. The accuracy of the "spot elevation", the most commonly used reference elevation, is typically +/- 0.1 of the contour interval of the topographic map (USGS national map accuracy standards). Most accurate is the bench mark which may be +/- 0.1 foot. The accuracy of Bouguer anomaly is a function of the instrument reading accuracy, elevation accuracy (0.06 mgal/foot of error) and the terrain correction.
Areas with no aeromagnetic data are flagged with dummy values (-1e+32), which are described for the grids in a grid_facts.txt file.
The aeromagnetic data in this file were collected by various contractors or groups who were responsible for collecting and processing the data. The data used to make these grids were collected using instruments (magnetometers, altimeters, and navigational systems) that varied from survey to survey, but were usually consistent within each survey.
Aeromagnetic survey contracts specified the conditions and specifications under which these data were collected. Standard industry practices at the time each survey was flown were followed in data collection and processing.
The gravity data in this report were collected by various investigators, from 65 separate sources. All of the data are from the files of the National Geophysical Data Center (NGDC) <http://www.ngdc.noaa.gov/seg/gravity/>.
More details are found in the report describing the compilation of the original grids: <http://pubs.usgs.gov/of/2005/1052>
Are there legal restrictions on access or use of the data?
- Access_Constraints: none
- Use_Constraints: none
703-648-6384 (voice)
703-648-6252 (FAX)
ssnyder@usgs.gov
Although all data published in the grids have been used by the USGS, no warranty, expressed or implied, is made by the USGS as to the accuracy of the data and related materials. The act of distribution shall not constitute any such warranty, and no responsibility is assumed by the USGS in the use of these data or related materials.Any use of trade, product, or firm names is for descriptive purposes only and does not imply endorsement by the U.S. Government.
703-648-6384 (voice)
ssnyder@usgs.gov