 |
Coastal Vulnerability Assessment of National Park of American Samoa to Sea-Level Rise
USGS Open-File Report 2005-1055
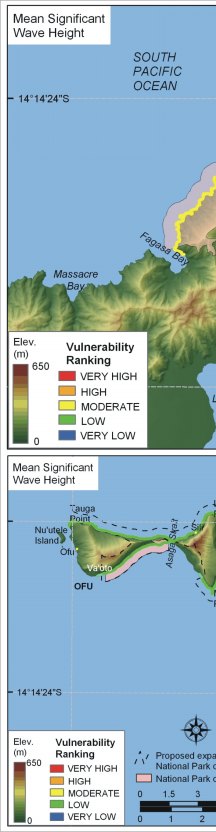
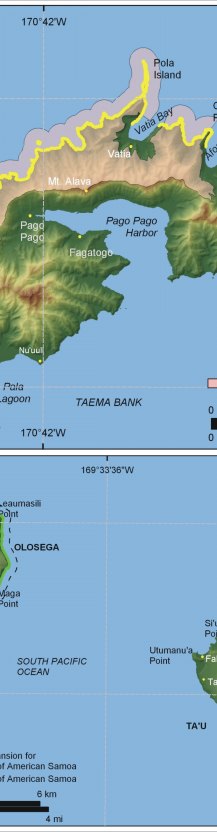
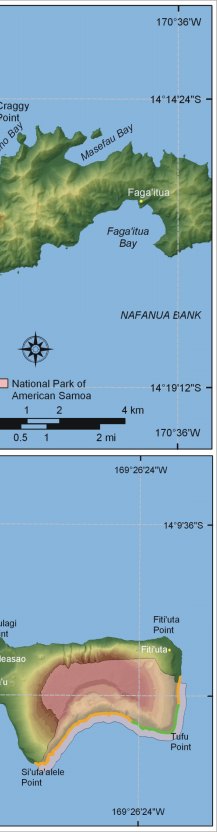
Figure 11. Vulnerability ranking for mean significant wave heights for the National Park of American Samoa based on World Wave Atlas data. The colored shoreline represents the mean significant wave heights within the park. Waves are largest along the south and southeast facing coasts (high vulnerability), although areas with fringing coral reef experience low vulnerability wave heights at the shoreline (e.g. Ofu and Olosega). | ||
 |
 |
 |
 [an error occurred while processing this directive]