
Coastal Vulnerability Assessment of War in the Pacific National Historical Park to Sea-Level Rise
USGS Open-File Report 2005-1056
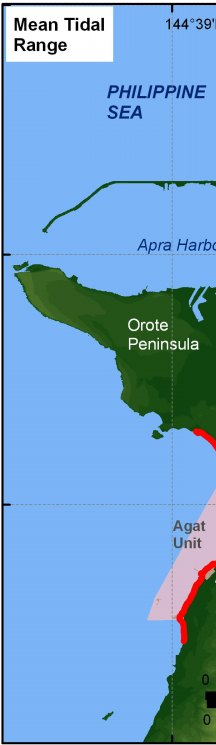
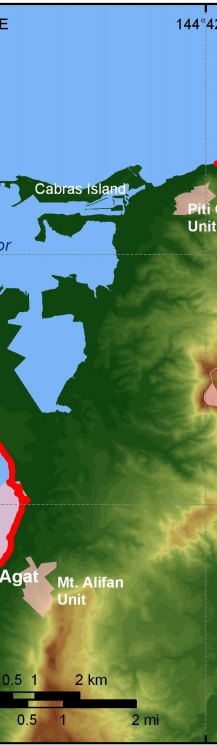
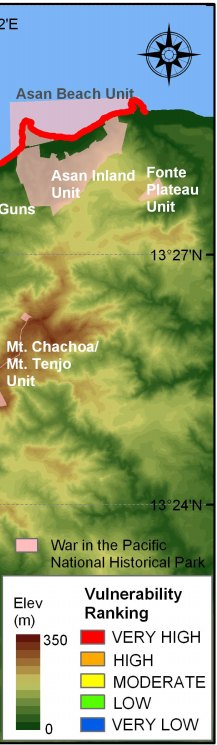
Figure 10. Mean Tidal Range for War in the Pacific National Historical Park. The colored shoreline represents the ranked mean tidal range based on a gage in Apra Harbor. All of War in the Pacific NHP is ranked as very high vulnerability with respect to tidal range. | ||
 |
 |
 |
