
Coastal Vulnerability Assessment of War in the Pacific National Historical Park to Sea-Level Rise
USGS Open-File Report 2005-1056
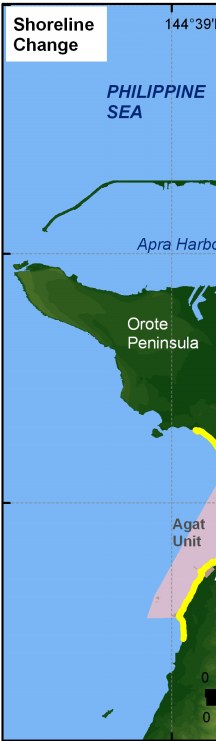
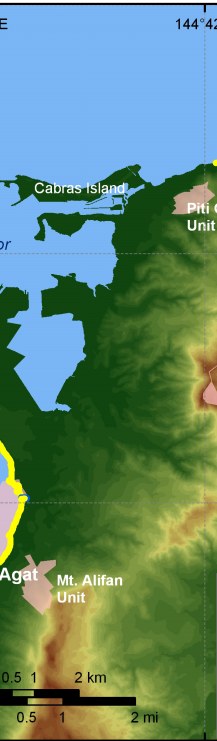
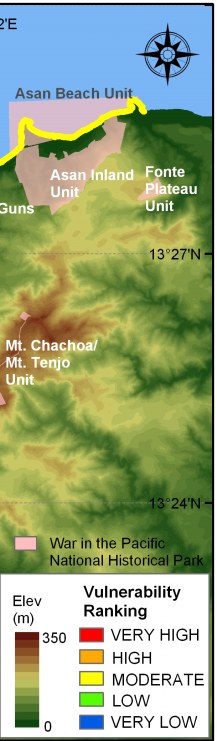
Figure 6. Shoreline change rates for War in the Pacific NHP. The colored shoreline represents the rate of shoreline erosion or accretion. All of War in the Pacific NHP is moderate vulnerability (-1m/yr - +1m/yr) with respect to shoreline change. | ||
 |
 |
 |
