
Coastal Vulnerability Assessment of Channel Islands National Park to Sea-Level Rise, USGS Open-File Report 2005-1057
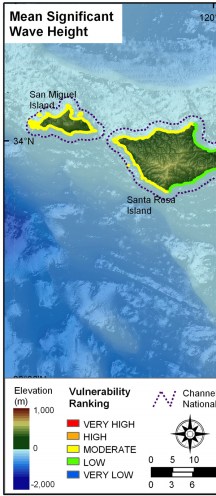
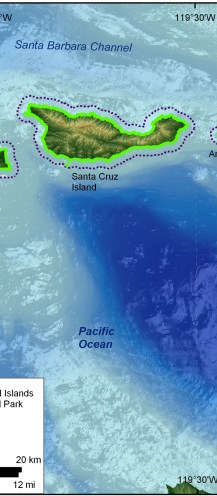
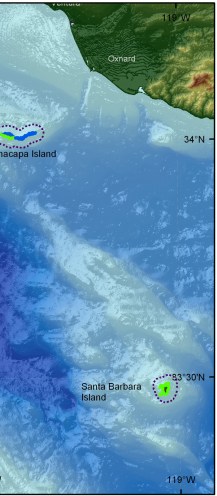
Figure 12. Mean significant wave heights for Channel Islands National Park. The colored shoreline represents the ranked mean significant heights within the park. The highest wave heights are on San Miguel and Santa Rosa Island and the lowest wave heights are on Anacapa Island. | ||
 |
 |
 |
