
Coastal Vulnerability Assessment of Channel Islands National Park to Sea-Level Rise, USGS Open-File Report 2005-1057
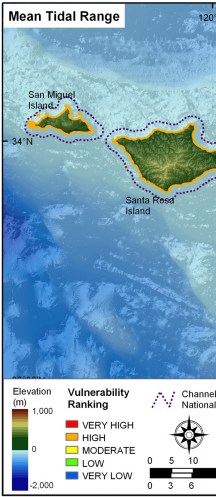
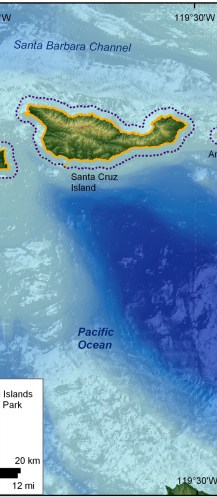
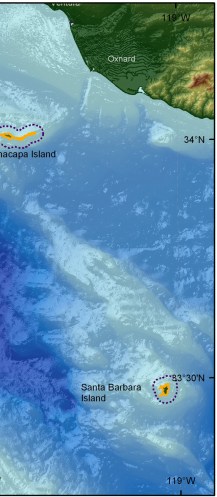
Figure 13. Mean Tidal Range for Channel Islands National Park. The colored shoreline represents the ranked mean tidal range for Channel Islands. All of Channel Islands National Park is ranked as moderate vulnerability with respect to tidal range. | ||
 |
 |
 |
