Skip past header information
USGS Logo with link to USGS Web page

Coastal Vulnerability Assessment of Channel Islands National Park to Sea-Level Rise, USGS Open-File Report 2005-1057

Back to Title Page

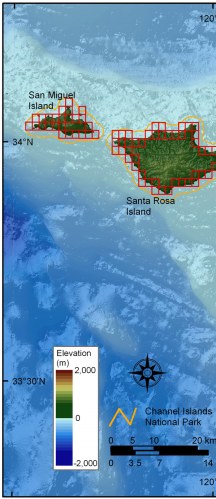
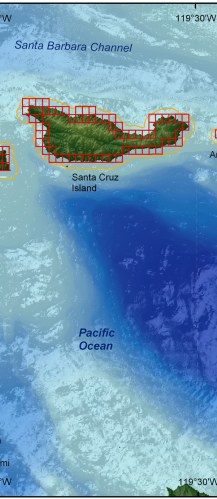
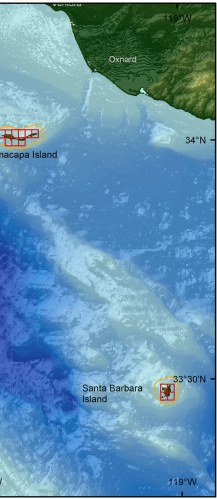
Figure 2. Shoreline grid for Channel Islands National Park. Each cell is approximately I-minute of shoreline and represents a shoreline segment for which each variable is defined.


Figure 2. Shoreline grid for Channel Islands National Park. Figure 2. Shoreline grid for Channel Islands National Park. Figure 2. Shoreline grid for Channel Islands National Park.

Skip Footer Information [an error occurred while processing this directive]