
Coastal Vulnerability Assessment of Golden Gate National Recreation Area to Sea-Level Rise
USGS Open-File Report 2005-1058
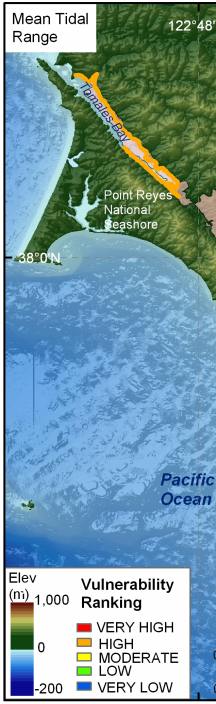
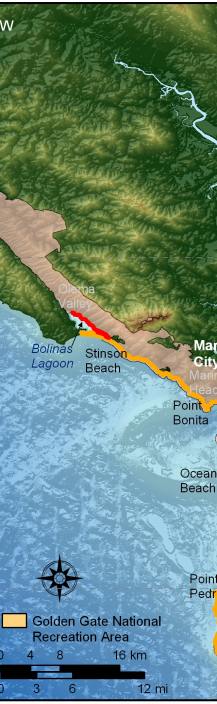
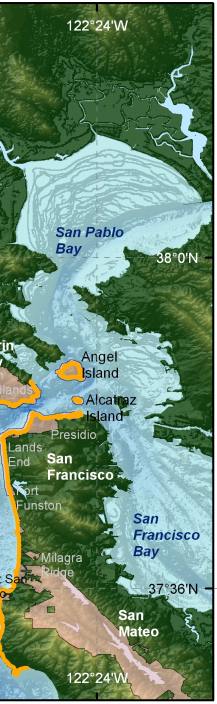
Figure 10. Mean Tidal Range for GGNRA. The colored shoreline represents the ranked mean tidal range for GGNRA. GGNRA is ranked mostly as high vulnerability with the exception of Bolinas Lagoon, which is very high vulnerability. | ||
 |
 |
 |
