
Coastal Vulnerability Assessment of Golden Gate National Recreation Area to Sea-Level Rise
USGS Open-File Report 2005-1058
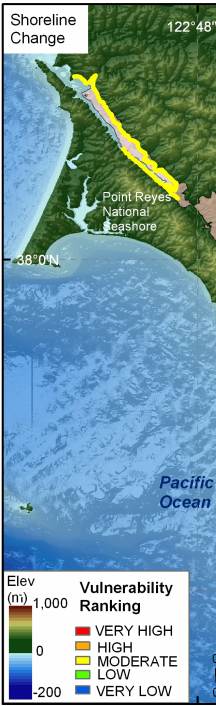
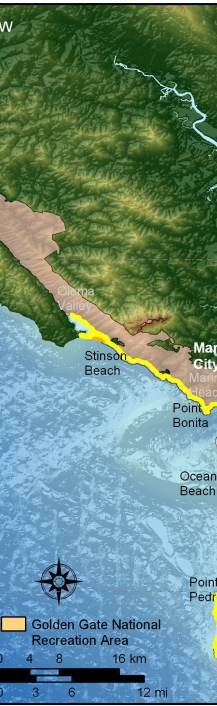
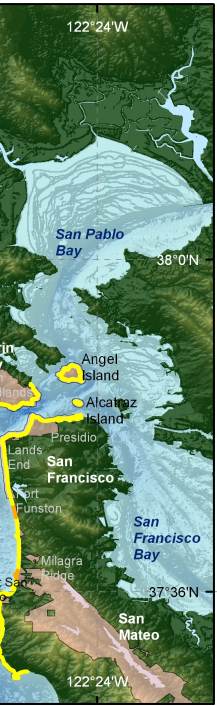
Figure 6. Shoreline change rates for GGNRA. The colored shoreline represents the rate of shoreline erosion or accretion. Most of GGNRA is moderate vulnerability (-1m/yr - +1m/yr) with respect to shoreline change; however, there are a few high vulnerability (-1 - -2 m/yr) areas. | ||
 |
 |
 |
