
Coastal Vulnerability Assessment of Golden Gate National Recreation Area to Sea-Level Rise
USGS Open-File Report 2005-1058
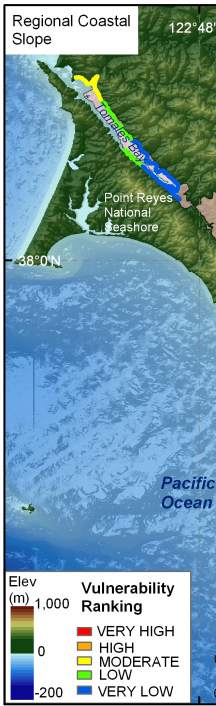
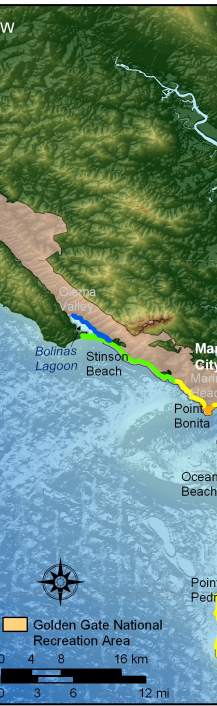
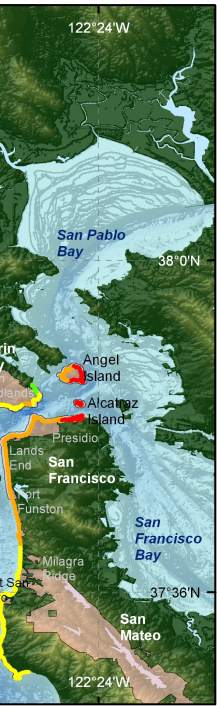
Figure 7. Regional coastal slope for GGNRA. The colored shoreline represents the regional slope of the land, 5 km landward and seaward of the shoreline. The highest vulnerability coastal slope areas are primarily within San Francisco. The lowest vulnerability coastal slope areas are to the north of San Francisco Bay or in Tomales Bay. | ||
 |
 |
 |
