
Coastal Vulnerability Assessment of Golden Gate National Recreation Area to Sea-Level Rise
USGS Open-File Report 2005-1058
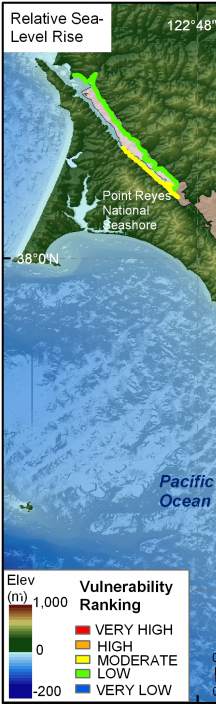
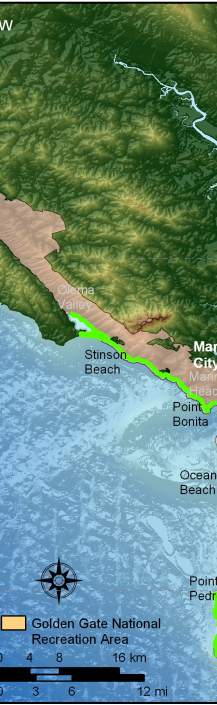
Figure 8. Rate of relative sea-level rise for GGNRA. The colored shoreline represents the ranked rate of rise for San Francisco and Point Reyes, CA. GGNRA is ranked as low and moderate vulnerability (along the Point Reyes peninsula) with respect to relative sea-level rise. | ||
 |
 |
 |
