Skip past header information
USGS Logo with link to USGS Web page


Coastal Vulnerability Assessment of Point Reyes National Seashore (PORE) To Sea-Level Rise
U.S. Geological Survey Open-File Report 2005-1059

Back to Title Page

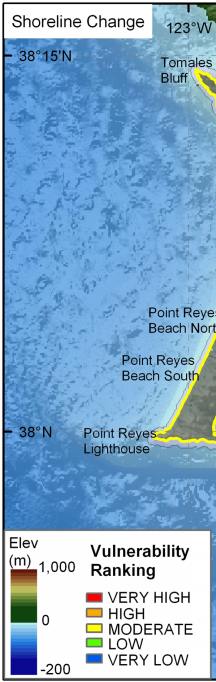
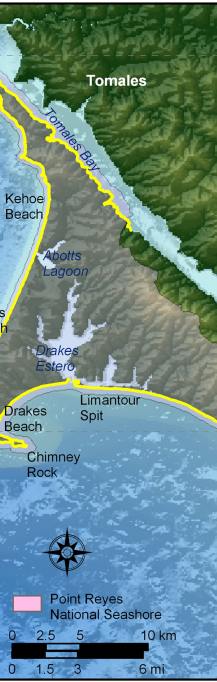
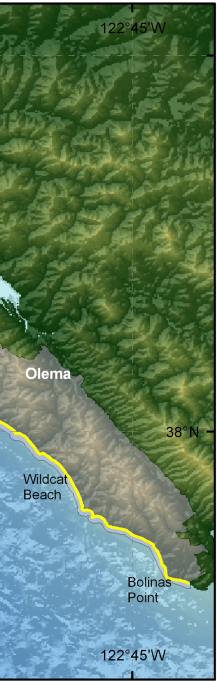
Figure 6. Shoreline change rates for Point Reyes National Seashore. The colored shoreline represents the vulnerability associated with the rate of shoreline erosion or accretion. All of Point Reyes is moderate vulnerability (-1m/yr to +1m/yr) with respect to shoreline change.

Figure 6.   Shoreline change rates for Point Reyes National Seashore. Figure 6.   Shoreline change rates for Point Reyes National Seashore. Figure 6.   Shoreline change rates for Point Reyes National Seashore.

Skip Footer Information