Skip past header information
USGS Logo with link to USGS Web page


Coastal Vulnerability Assessment of Point Reyes National Seashore (PORE) To Sea-Level Rise
U.S. Geological Survey Open-File Report 2005-1059

Back to Title Page

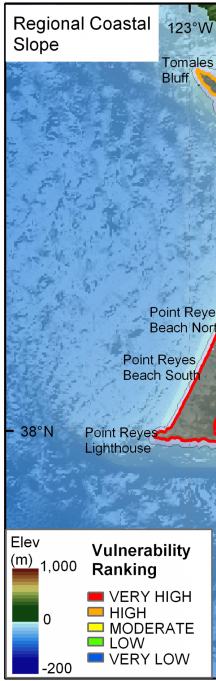
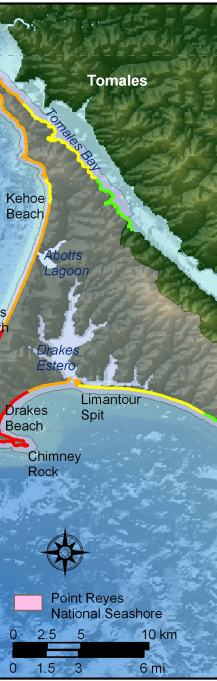
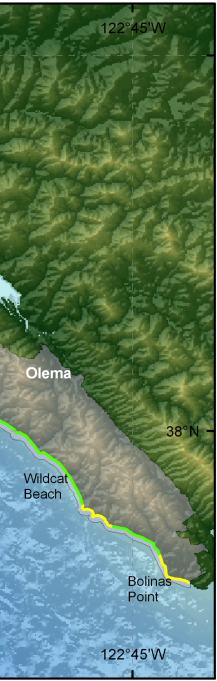
Figure 7. Regional coastal slope for Point Reyes National Seashore. The colored shoreline represents the vulnerability associated with the regional slope of the land, 10 km landward and seaward of the shoreline. The highest vulnerability slopes are generally Drakes Estero and points north and west. Lower vulnerability slopes are generally adjacent to the mainland or near the higher mountains to the south.

Figure 7.   Regional coastal slope for Point Reyes National Seashore. Figure 7.   Regional coastal slope for Point Reyes National Seashore. Figure 7.   Regional coastal slope for Point Reyes National Seashore.

Skip Footer Information