Skip past header information
USGS Logo with link to USGS Web page


Coastal Vulnerability Assessment of Point Reyes National Seashore (PORE) To Sea-Level Rise
U.S. Geological Survey Open-File Report 2005-1059

Back to Title Page

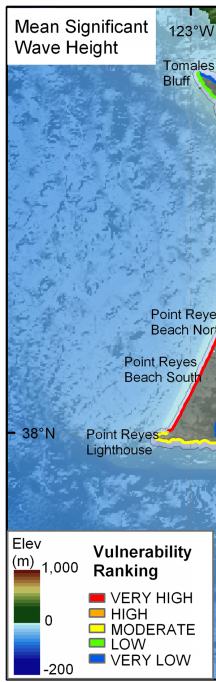
Figure 9. Mean Significant Wave Height for Point Reyes National Seashore. The colored shoreline represents the vulnerability associated with mean significant wave height within the park. Very High wave energy areas are located along the north side of Point Reyes where the dominant northwest waves approach. Wave heights are lowest in Tomales Bay and on the south side of Point Reyes.

Figure 11.   Mean Significant Wave Height for Point Reyes National Seashore. Figure 11.   Mean Significant Wave Height for Point Reyes National Seashore. Figure 11.   Mean Significant Wave Height for Point Reyes National Seashore.

Skip Footer Information