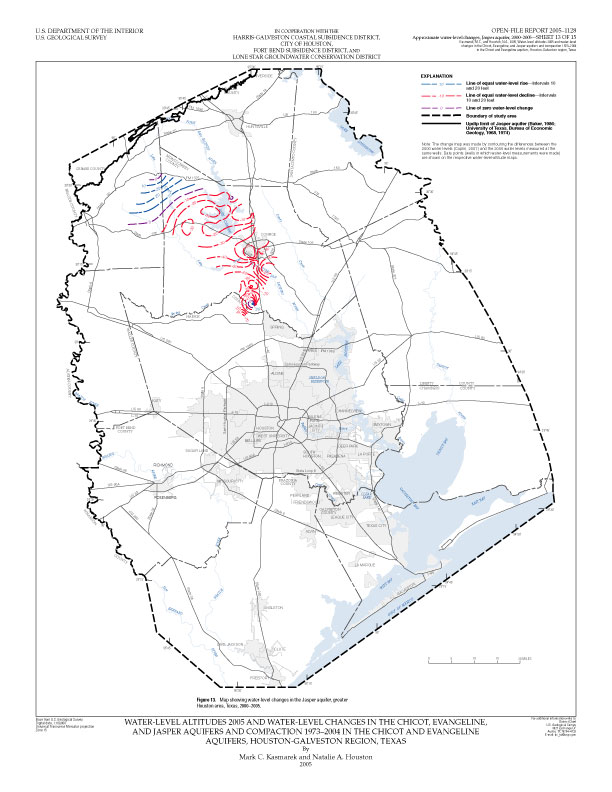
Figure 13. Map showing water-level changes in the Jasper aquifer, greater Houston area, Texas, 2000–2005.
Contents | Back to Text