|
|
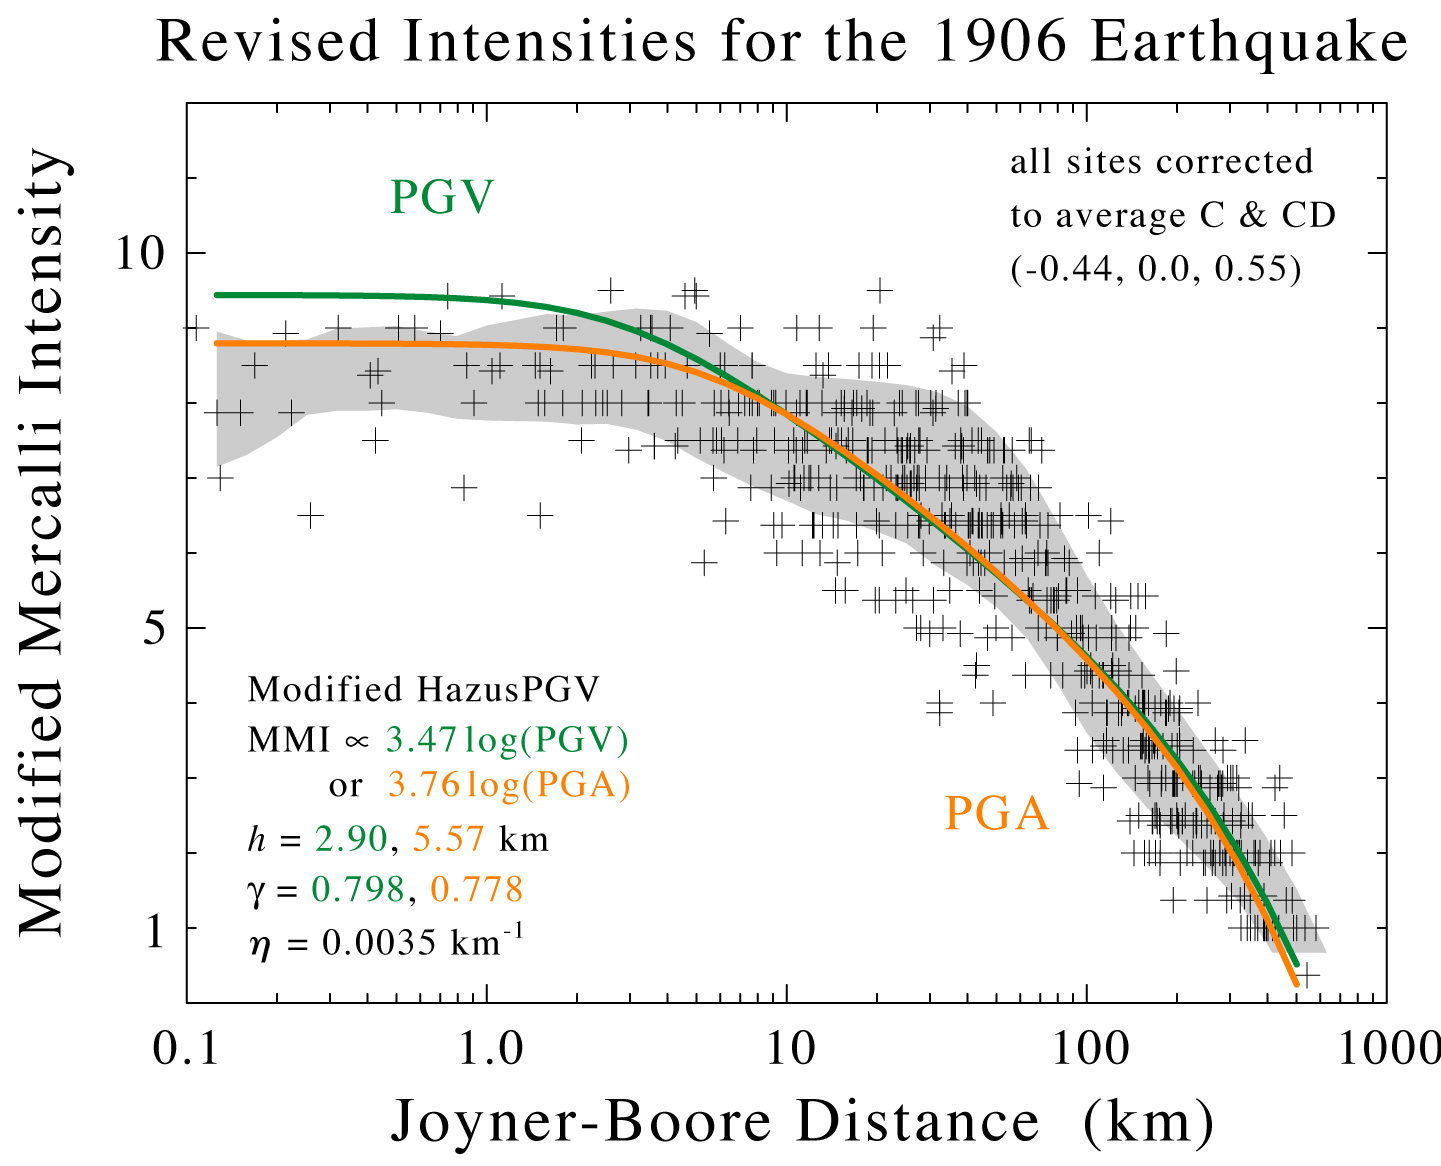
This plot shows the Modified Mercalli Intensities for ~ 600 sites plotted as a function of the Joyner-Boore distance from the fault trace (Joyner and Boore, 1979). The intensities are corrected for soil-type before plotting: the NERHP site class is determined from the Wills et al. (2001) geologic map of California. We have combined NEHRP-B and BC sites into a soft-rock class, NEHRP-C and CD sites into a soil class, and NEHRP-D and E sites into a soft-soil class. The intensity shifts for these aggregate soil/rock classes are obtained by averaging the residuals relative to C & CD sites. These shifts are written in the upper left hand corner of the plot: the soft-rock sites (B & BC) are deamplified by slightly less than half an intensity unit (-0.44) while the soft-soil sites (D & E) are amplified by slightly more than half an intensity unit (0.55).
The shaded area indicates the one standard deviation confidence interval for the running mean of the corrected intensity data. The intensities are effectively flat at distances near the fault (rJB < 10 km), then falloff only slightly to rJB > 80 km. There is some variability of the intensities at these intermediate distances. Beyond 100 km, however, the intensities behave very consistently, falling off sharply.
To generate the MMI ShakeMaps, we invert the relations between PGA (in %g) and PGV (in cm/s) and instrumental intensity derived by Wald et al. (1999)
Imm = 3.66*log PGA + 1.99
Imm = 3.51*log PGV + 2.35
to estimate PGA(I) and PGV(I) for each site and then follow the usual ShakeMap methodology. That is, we correct the peak motion to NEHRP-B, regress the data to estimate the source term (or bias), use this bias with the attenuation function to estimate peak ground motion at the false stations, interpolate a map of the peak motions for NEHRP-B, and finally apply the site amplifications derived from the geology.
The orange line shows the Imm estimated as a function of Joyner-Boore distance using the Boore et al. (1997) relationship for PGA
lnPGA = - 0.313 + 0.527 (M-6) - 0.778 ln rJB - 0.0035 rJB - 0.371 ln(1396/605)
or
lnPGA = 0.946 - 0.778 ln rJB - 0.0035 rJB
which has been modified to fit the distances rJB > 80 km by adding the exponential falloff exp[-0.0035 rJB].
The green line shows the Imm estimated as a function of Joyner-Boore distance using the Boore et al. (1997) relationship for PSA at 1 s,
lnPSA = - 1.133 + 1.036 (M-6) - 0.798 ln rJB - 0.0035 rJB - 0.698 ln(1406/605)
or
lnPSA = 1.320 - 0.798 ln rJB - 0.0035 rJB
which has also been modified to fit the distances rJB > 80 km by adding the exponential falloff exp[-0.0035 rJB]. Wald et al. (1999) use the 1982 Newmark-Hall relationship
PGV = 0.9467 PSA
to estimate PGV from PSA. The PGV curve overestimates the intensities at distances close to the fault. We note that ShakeMap uses PGV to estimate Imm > 6, and PGA for Imm ≤ 6.