 |
|
|
||||
| U.S. Geological Survey Open-File Report 2005-1192 |
Published 2005
By John C. Mars, Christopher P. Garrity, David W. Houseknecht, Lee Amoroso, and Donald C. Meares
A set of landform and land cover maps has been completed for the northeastern part of the National Petroleum Reserve, Alaska (NPRA). This set of 1:63,360-scale maps consists of a color shaded-relief map (5 m resolution data), a surface classification map (30 m resolution data), and a shaded relief-surface classification map generated by fusing the two datasets. Remote sensing data used to compile the maps include Landsat 7 Enhanced Thematic Mapper Plus (ETM+) and Interferometric Synthetic Aperture Radar (IFSAR).
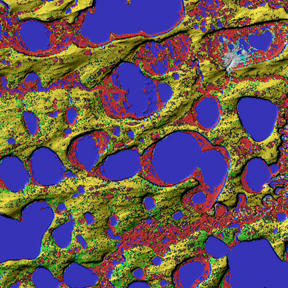 |
| Thumbnail from plate 3, Shaded ReliefñSurface Classification Map of the Fish Creek Area, Harrison Bay Quadrangle, Northern Alaska |
Image analysis of the Landsat 7 ETM+ data defined six spectral units for the surface classification and shaded relief-surface classification map. The six spectral units include water/ice, green vegetation, dry vegetated sand, wet vegetated sandy mud, clean sand, and muddy sand. Green vegetation and water/ice were defined by using a band 4/3 ratio and a threshold of band 5, respectively. Dry vegetated sand, wet vegetated sandy mud, clean sand, and muddy sand spectral units were defined by selecting representative image spectra from landforms defined from Landsat 7 ETM+ and IFSAR imagery. Selection of specific landforms was based on inferred sediment types associated with the depositional environment that produced the landform, and from a published USGS 1:250,000 geologic map of the study area. An ENVI matched filtering algorithm was used to map the extent of materials represented by these spectral units.
The dry vegetated sand spectral unit primarily mapped eolian and marine dunes. The wet vegetated sandy mud spectral unit primarily mapped lake sediments. Clean sand and muddy sand spectral units mapped eolian dune blowout features, modern fluvial sands, and deltaic deposits. A combination of dry vegetated sand and green vegetation spectral units mapped flood plain deposits.
The shaded relief-surface classification map was pan-sharpened using IFSAR 5 m data. The composite data illustrate that patterns and combinations of spectral units correspond to specific topographic features such as eolian and coastal ridges, thaw lakes, and river valleys. This correspondence between topographic features and spectral units was investigated in the field and is due to different vegetation types and degree of vegetation stress, which is associated with topography and depth to permafrost.
NOTE: Download the large PDF files to your computer completely before trying to open them. PC: right-click; Macintosh: control-click
![]()
Open-File Report 2005-1192 text [10-page Adobe PDF file]
Open-File Report 2005-1192 figures at screen resolution [5.7-MB Adobe PDF file]
Open-File Report 2005-1192 figures at high resolution [51-MB Adobe PDF file]
All three plates measure 63 x 36 inches. Each is presented as a PDF file suitable for screen viewing and as a PDF file suitable for plotting at high resolution.
Plate 1. Color ShadedñRelief Map of the Fish Creek Area, Harrison Bay Quadrangle, Northern Alaska
For scientific questions or comments concerning this report, contact John C. Mars or Christopher P. Garrity.
| AccessibilityFOIAPrivacyPolicies and Notices | |
 |
|