
USGS Open-file Report 2005-1207 online version 1.0
Summary of Supporting Data for USGS Regional Heat-flow Studies of the Great Basin, 1970-1990
by John H. Sass(1), Susan S. Priest(1), Arthur H. Lachenbruch(2), S. Peter Galanis, Jr.(2), Thomas H. Moses, Jr.(2), John P. Kennelly, Jr.(2), Robert J. Munroe(2), Eugene P. Smith(2), Frederick V. Grubb(2), Robert H. Husk, Jr.(2), and Charles W. Mase(2)
U.S. DEPARTMENT OF THE INTERIOR
Gale Norton, Secretary
U.S. GEOLOGICAL SURVEY
Charles G. Groat, Director
The Great Basin of the western United States provides a large and accessible laboratory for the study of crustal extension and related tectonic processes. One of the most important parameters related to these processes is the surface heat flow. Early studies (Roy et al., 1968a; Sass et al., 1971b) revealed a complex thermal regime. The Great Basin is characterized by high heat flow in relation to the continental craton, but it contains large sub-provinces of relatively low (< 60 mW m-2) and elevated (> 100 mW m-2) heat flow. With a small number of measurements, Roy et al. (1968b) defined a heat flow-heat production province based on an apparently linear relation between near-surface heat flow and radiogenic heat production of plutonic, intrusive rocks. Subsequent studies (Lachenbruch and Sass, 1977, 1978; Lachenbruch et al., 1985; Lachenbruch et al., 1994; Sass et al., 1994) revealed that the early apparent relation was fortuitous, and that many factors (in addition to radioactivity) are responsible for variations in near-surface heat flow.
The heat flow-heat production relation in the Great Basin is perturbed by a combination of tectonic and hydrologic processes that overwhelm the conductive thermal regime in the upper crust. These include tectonic extension often accompanied by magmatic underplating and/or crustal intrusion, and hydrothermal convection associated with young magmatic activity and deep circulation along Basin and Range faults (Lachenbruch and Sass, 1977, 1978).
Sass et al. (1971b) published all of the heat flow values accumulated by the U.S. Geological Survey (USGS) for the Western United States from the late 1950s through the 1960s. Details of temperature- and thermal-conductivity profiles for individual sites were included in Sass and Munroe (1974). Additional data were obtained in the Great Basin during the 1970s and 1980s to support both tectonic studies and assessment of the geothermal potential of the region. For the most part, these data were not published individually, but were included in site-specific geothermal reports or incorporated into generalized heat-flow contour maps of the Southwestern United States (eg., Figure 1). In a detailed study of the heat flow of the southern Basin and Range province, Lachenbruch et al. (1994) and Sass et al. (1994) compared average heat flows between the southern Basin and Range and the Great Basin to illustrate the differences between the two terrains. The averages for the Great Basin include almost all of the values presented here.
In 1998, we acquired temperature data from over 700 geothermal industry “temperature-gradient” holes. These data were digitized, and published on the web in USGS Open-file Report 99-425 (Sass et al., 1999). Temperature tabulations and graphs may be accessed by clicking on the appropriate symbols on the main map or subsidiary maps.
At this web site, we present a map with site locations (Plate 1). The supporting data for each site are summarized in Table 1 and subsidiary tables. When the “Expanded Designation” line in Table 1 specifies that it is a composite, details will be found in the appropriate subsidiary table which can be accessed by clicking on the title at the bottom of the page. We make additional comments, where appropriate, for the “composite sites”. Some of the maps showing local distribution of heat-flow values also show the geology of the area. The geology was generalized from the 1:250,000 scale Geologic Maps of California series.
Sass and Walters (1999) presented generalized values of thermal conductivity for the unconsolidated sediments of playas and alluvial valleys, derived from several hundred conductivity values obtained by the USGS in the course of geothermal investigations in the Western United States. These were high-quality determinations, made soon after retrieval (often in the field) of sediment cores or in situ employing a downhole heat-flow probe developed by Sass et al., 1979a, 1981). Some of these results have been published, but others (Warner Valley and Mono Lake) have not. We present here a series of histograms of these measurements illustrating the generality of the conductivity values adopted by Sass and Walters.
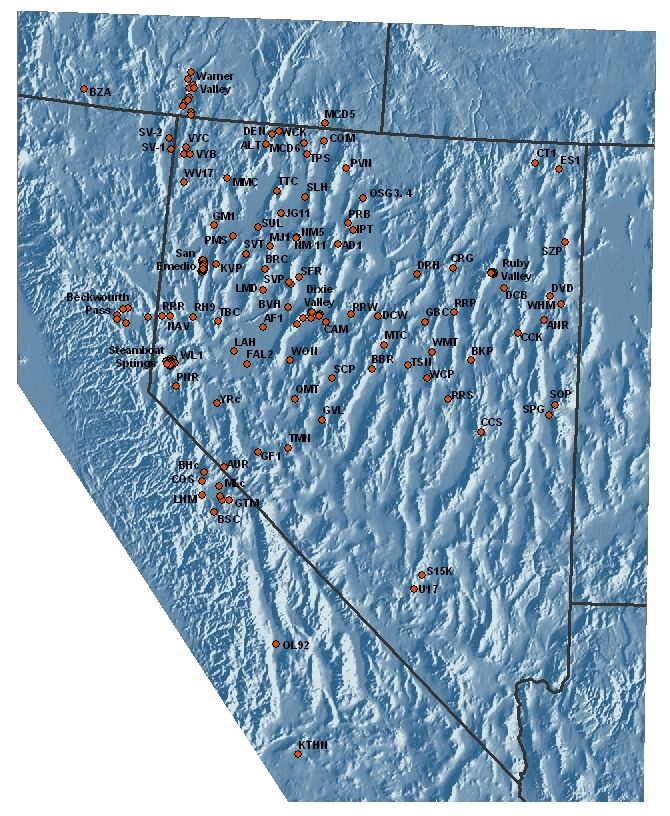
Plate 1. The Great Basin
Bodie Hills-Mono Lake, California
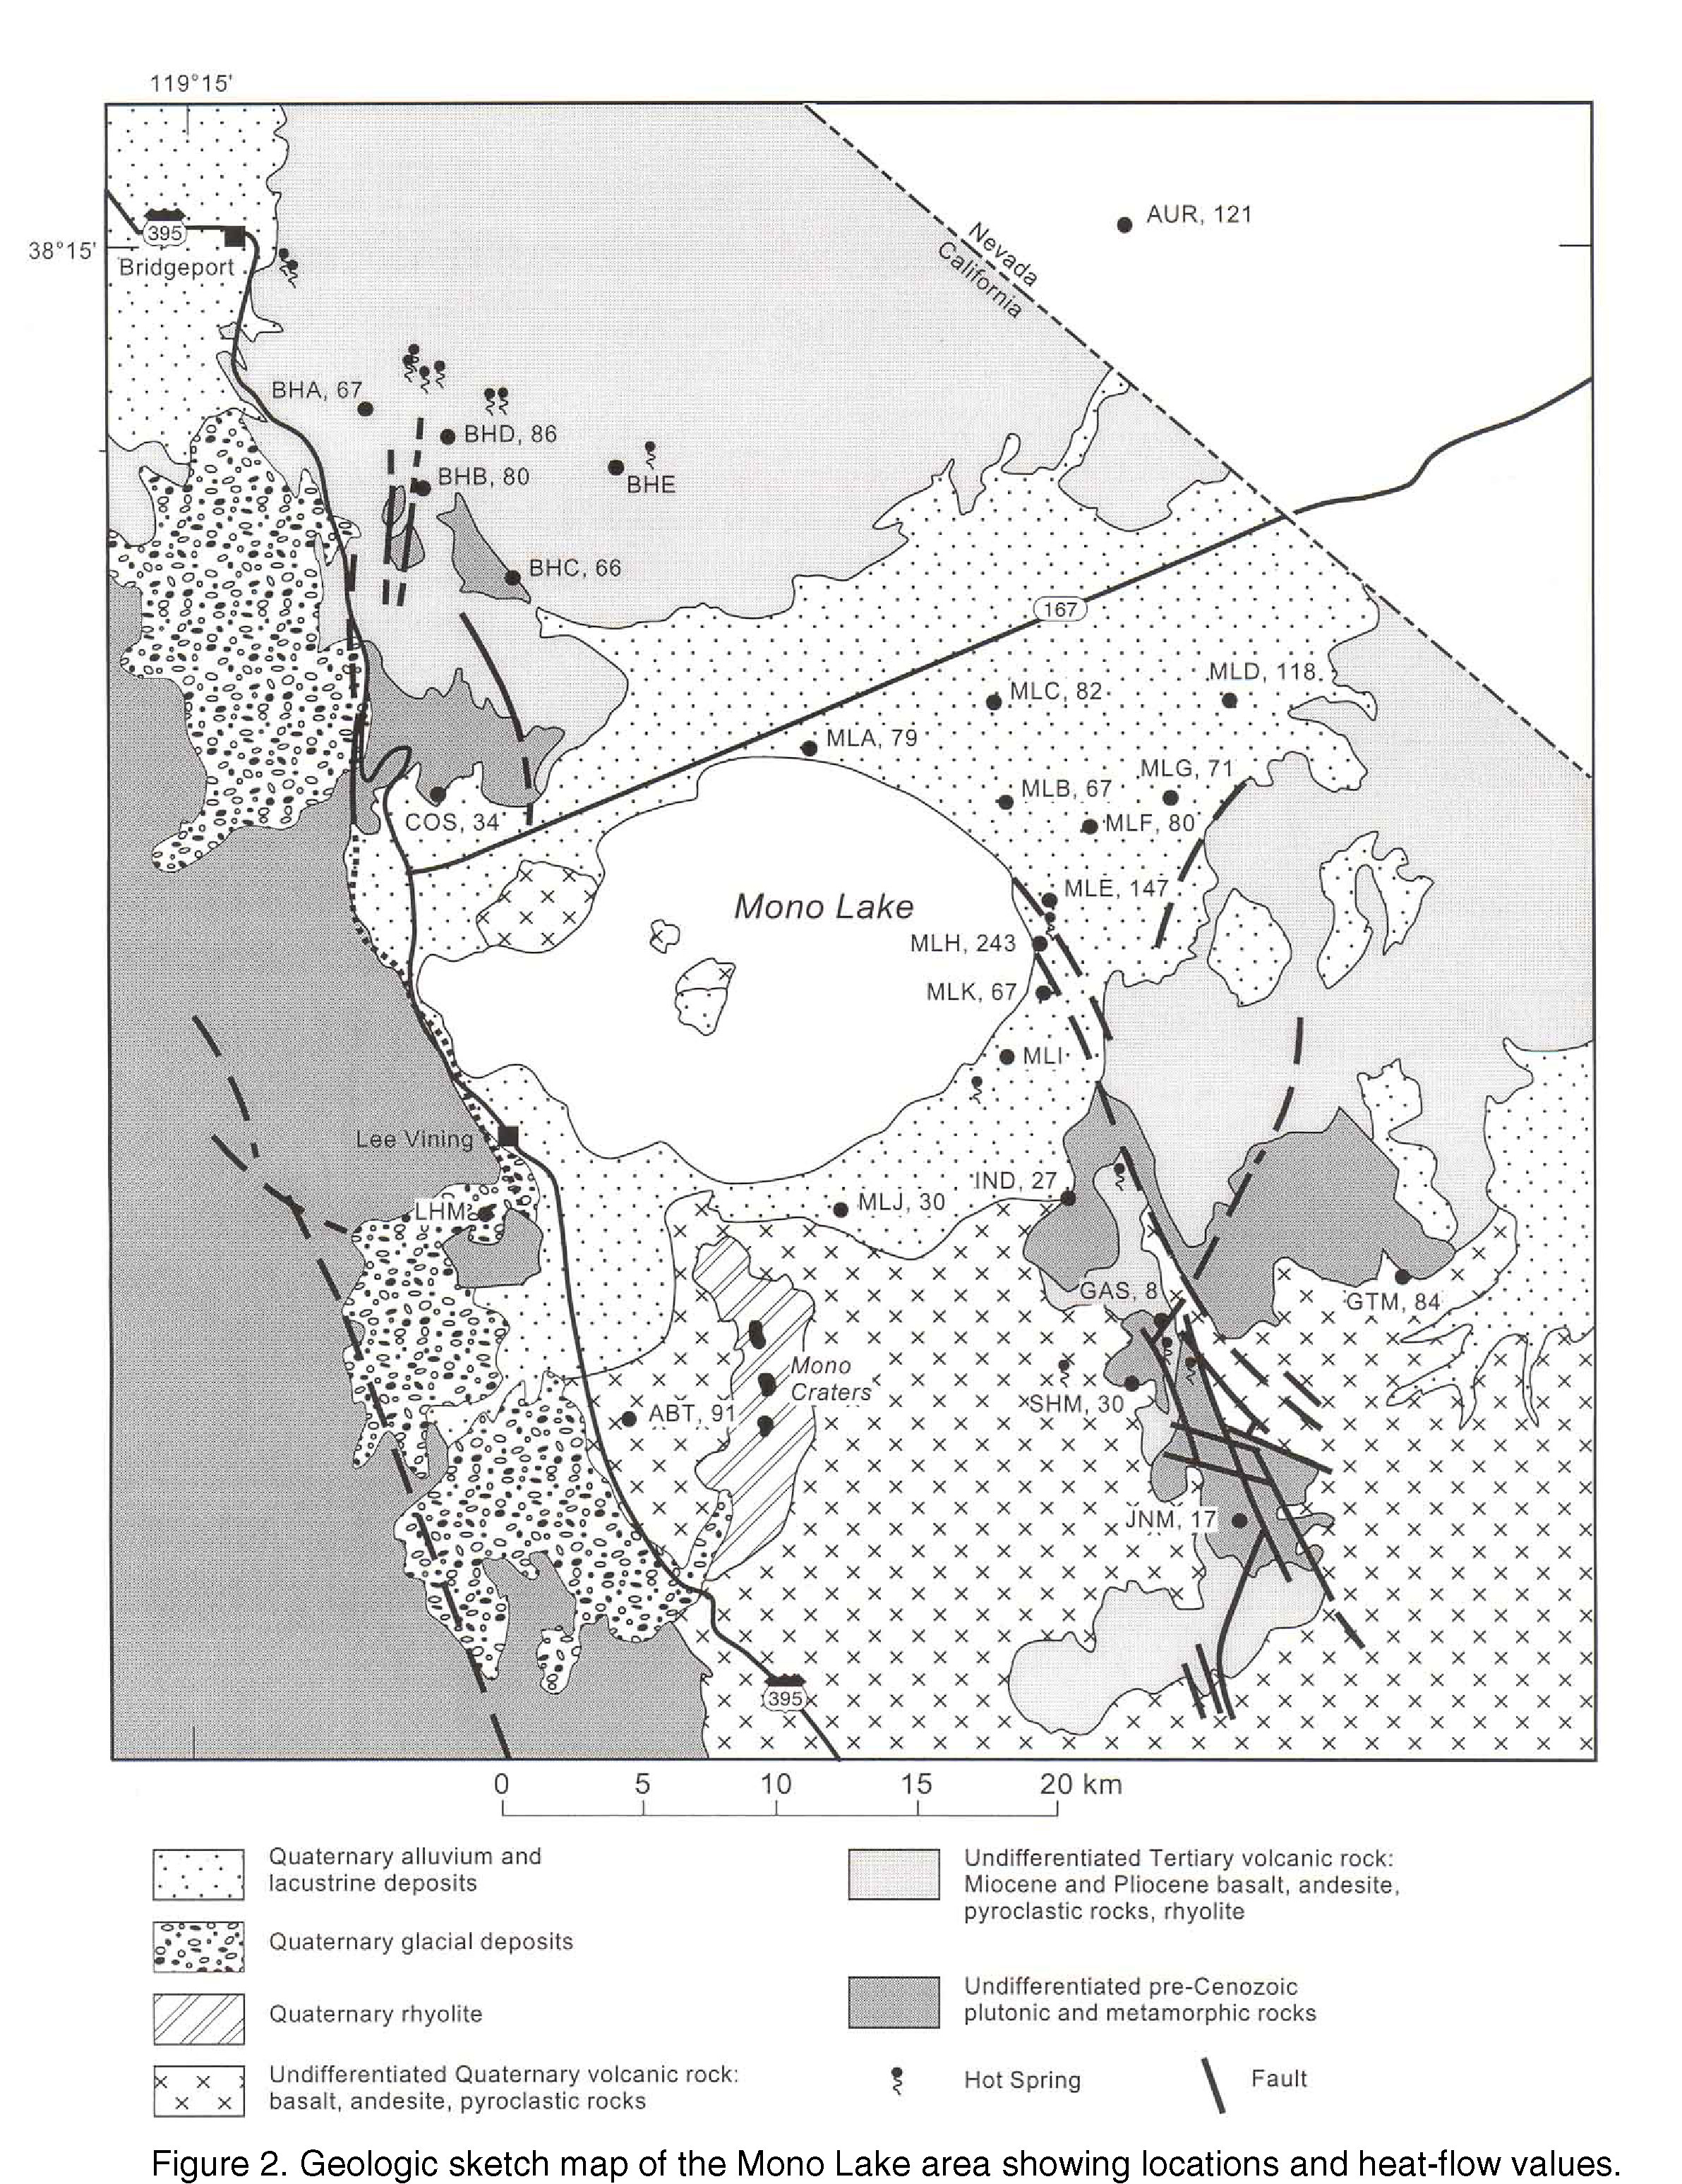
Table 1a summarizes heat flow from crystalline rocks south of Mono Basin. Samples are from the volcanically derived alluvial deposits of the Mono Basin and also from a series of exploration holes drilled in the basaltic rocks of the Bodie Hills. Owing to the environmental sensitivity of the Mono Basin, we deployed the downhole “push probe” (Sass et al, 1981) to minimize the “footprint” of the heat-flow studies.
Figure 2 shows the location and heat-flow values of the various sites relative to Mono Lake and its surroundings. Despite the numerous thermal springs in the area, and some very young geologic features, most of the heat-flow values are low-to moderately high (30-120 mW m-2), as might be expected in this complex transition between the Sierra Nevada and the Great Basin.
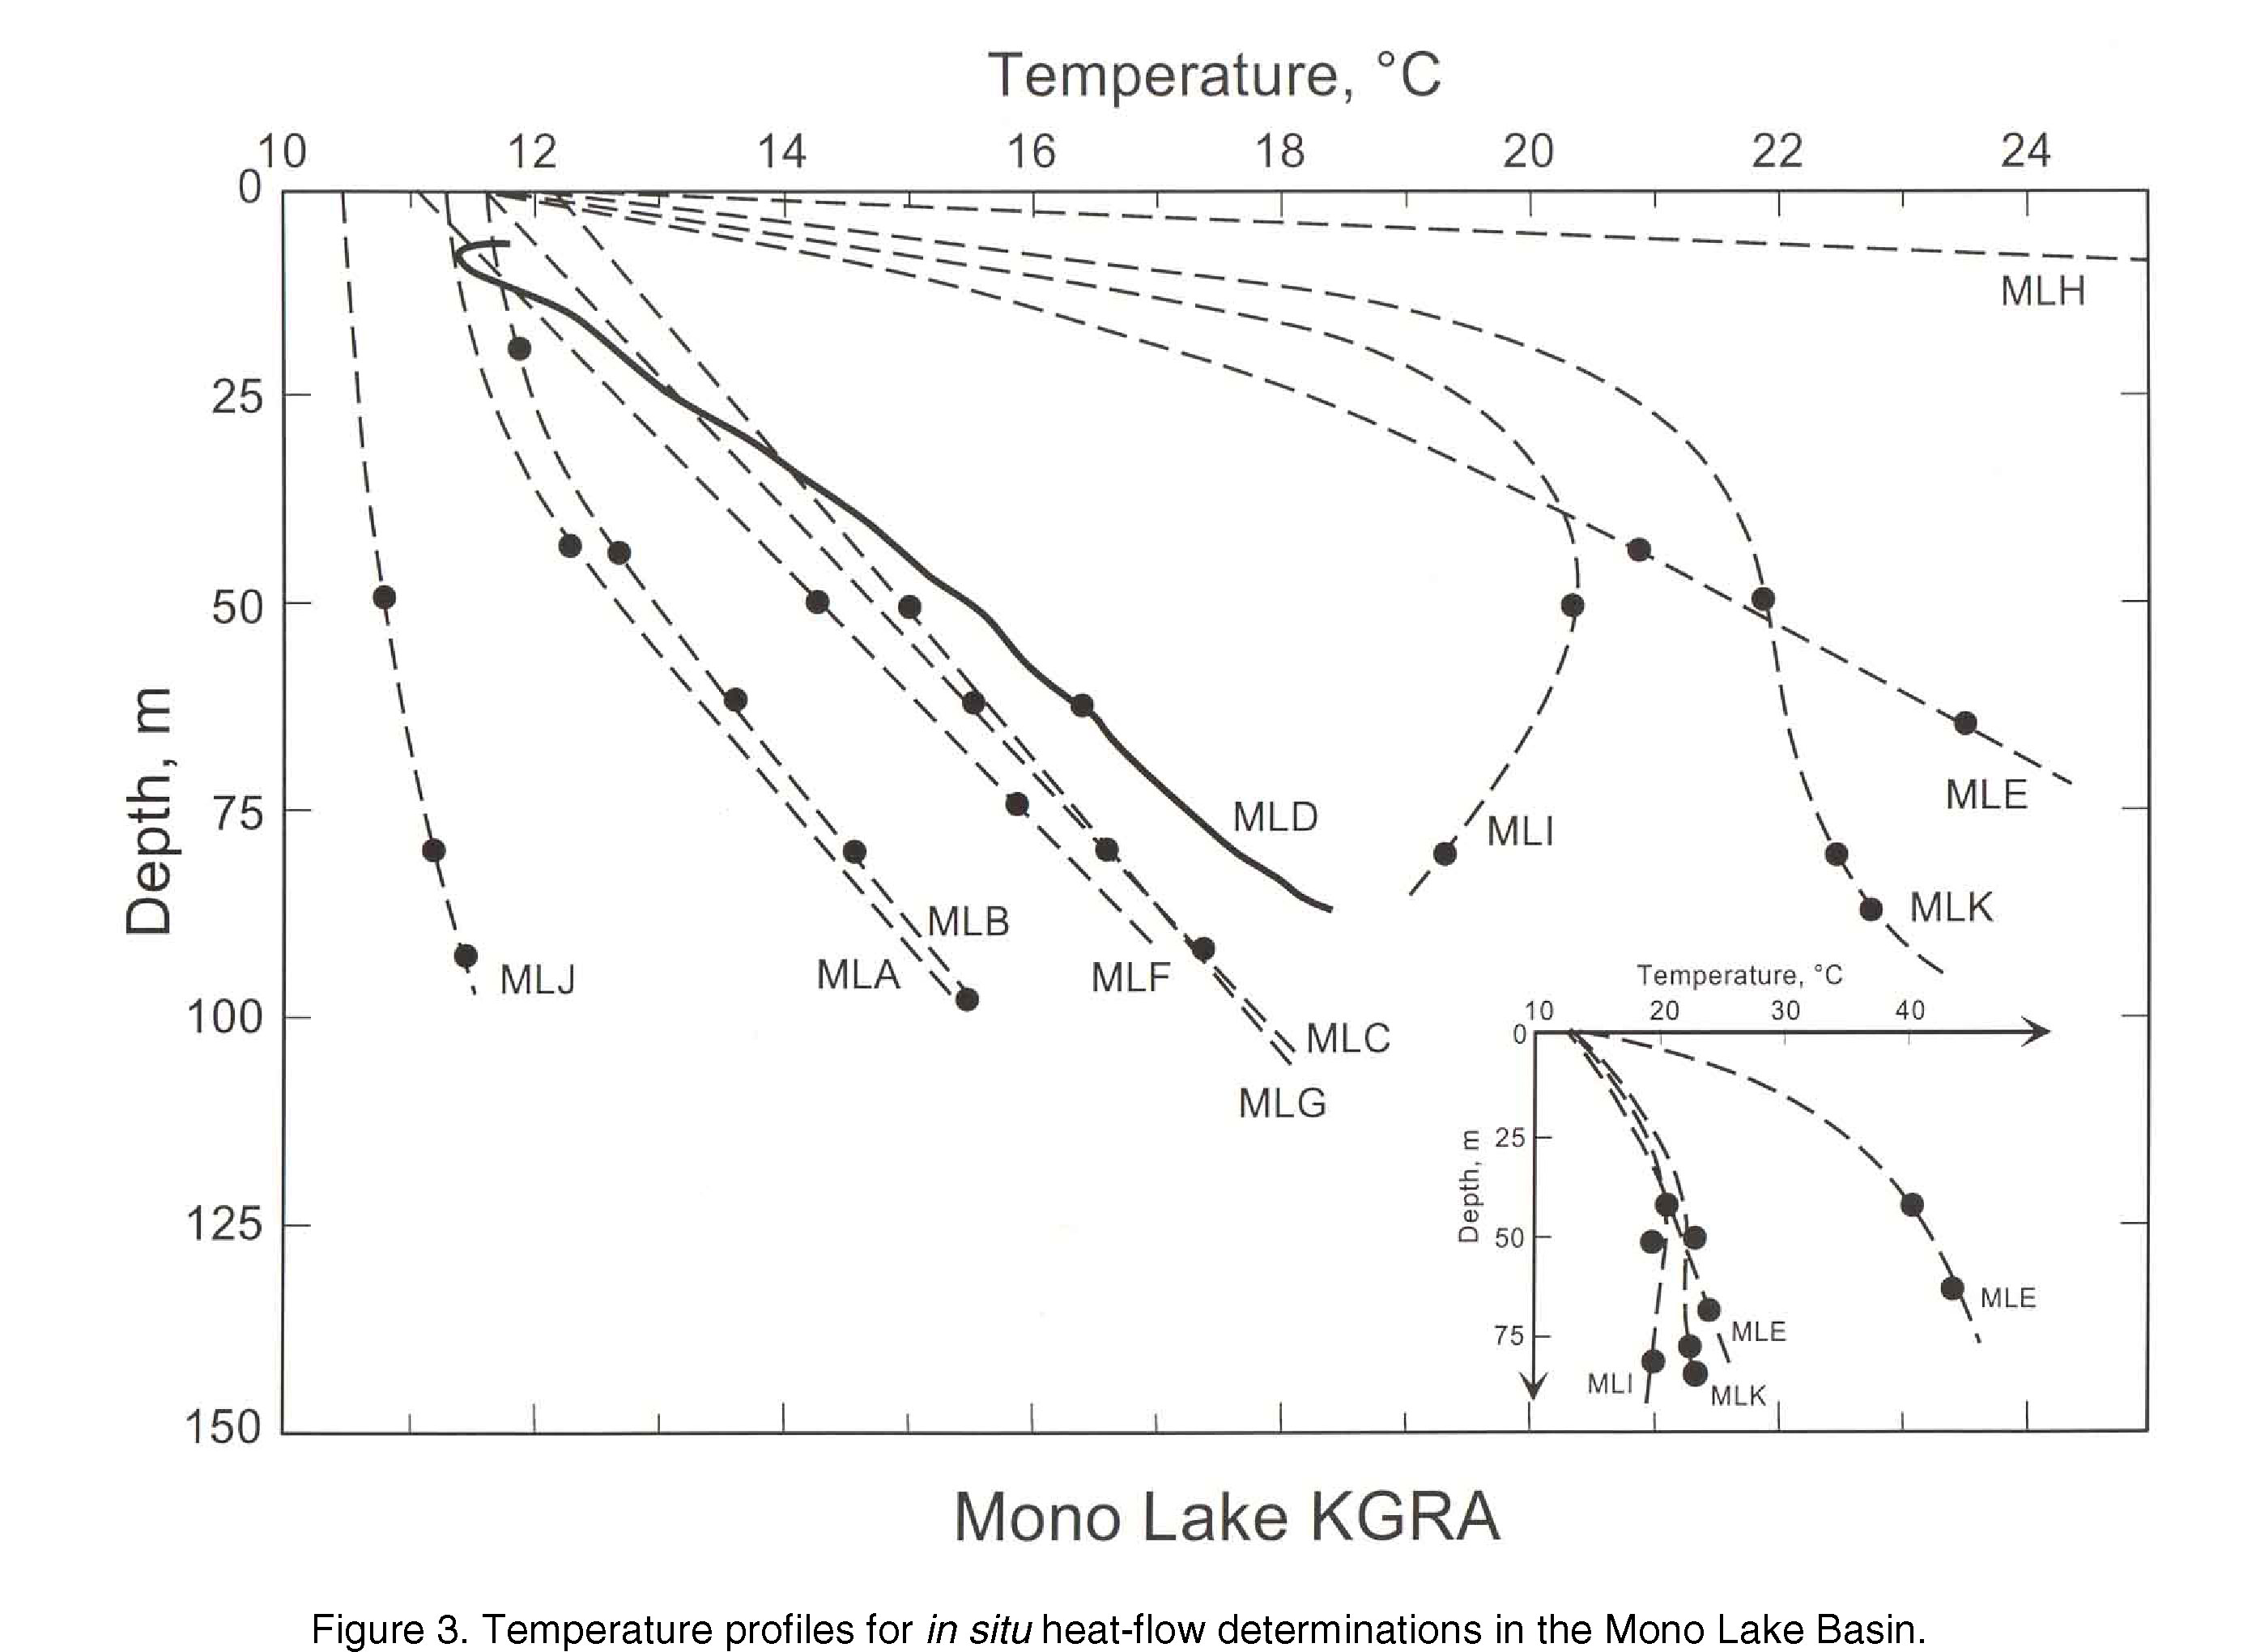
We present individual in situ temperature determinations for the Mono Lake Basin and our interpretations of them in Figure 3. We were only able to obtain a single probe penetration in MLD, so the hole was cased for later temperature logging. Logged temperatures at that depth illustrate the validity of the temperature obtained with the push-probe during drilling.
Figure 4 is a histogram of the thermal conductivities obtained in situ using a down-hole heat-flow probe at Mono Lake. These are discussed below in the context of generalizing thermal conductivities from the Great Basin.
NURE, Carson Sink (LAH), Nevada
A 2.5 km deep hole was drilled as part of the National Uranium Resource Evaluation (NURE) program in 1977. We were able to preserve the uppermost 1420 m for post-drilling temperature logs. The log (Figure 5) indicates a decrease in temperature gradient with depth corresponding to an increase in thermal conductivity. In the upper 1000m, this results from a combination of compaction and lithification of the sediments of the Carson Sink. Below that, are sedimentary rocks of the Pliocene Truckee Formation and basaltic to rhyolitic tuffs of the late Miocene to Pliocene Desert Peak Formation.
Thermal conductivities were measured on drill cuttings, and we were able to make some estimates of porosity from neutron and gamma-gamma density logs. Table 1b presents estimates of thermal conductivity and heat flow at 200-meter intervals (no samples were available in the interval 300-600 m). Estimates of heat flow were made using grain conductivities, and conductivities using porosity estimates based on the assumption of constant vertical heat flow and constrained by the geophysical logs. The assumption of 0 porosity implicit in the former calculation is clearly unrealistic, but the average heat flow of 115 mW m-2 between 600 and 1400 m provides a well-documented upper limit. Both neutron and density logs indicate porosities in the range of 30 to 40 % for the upper 300m, and between 5 and 10% in the tuffs between the depths of 1200 and 1400 m. Based on these constraints and the assumption of constant, conductive heat flow below 100 m, we constructed the porosity profile shown in Table 1b. The conspicuous uniformity of component heat flows is, of course, imposed by the assumption of constant heat flow. Nevertheless, we consider the average value of 100 mW m-2 a robust estimate of regional heat flow.
Warner Valley, Oregon
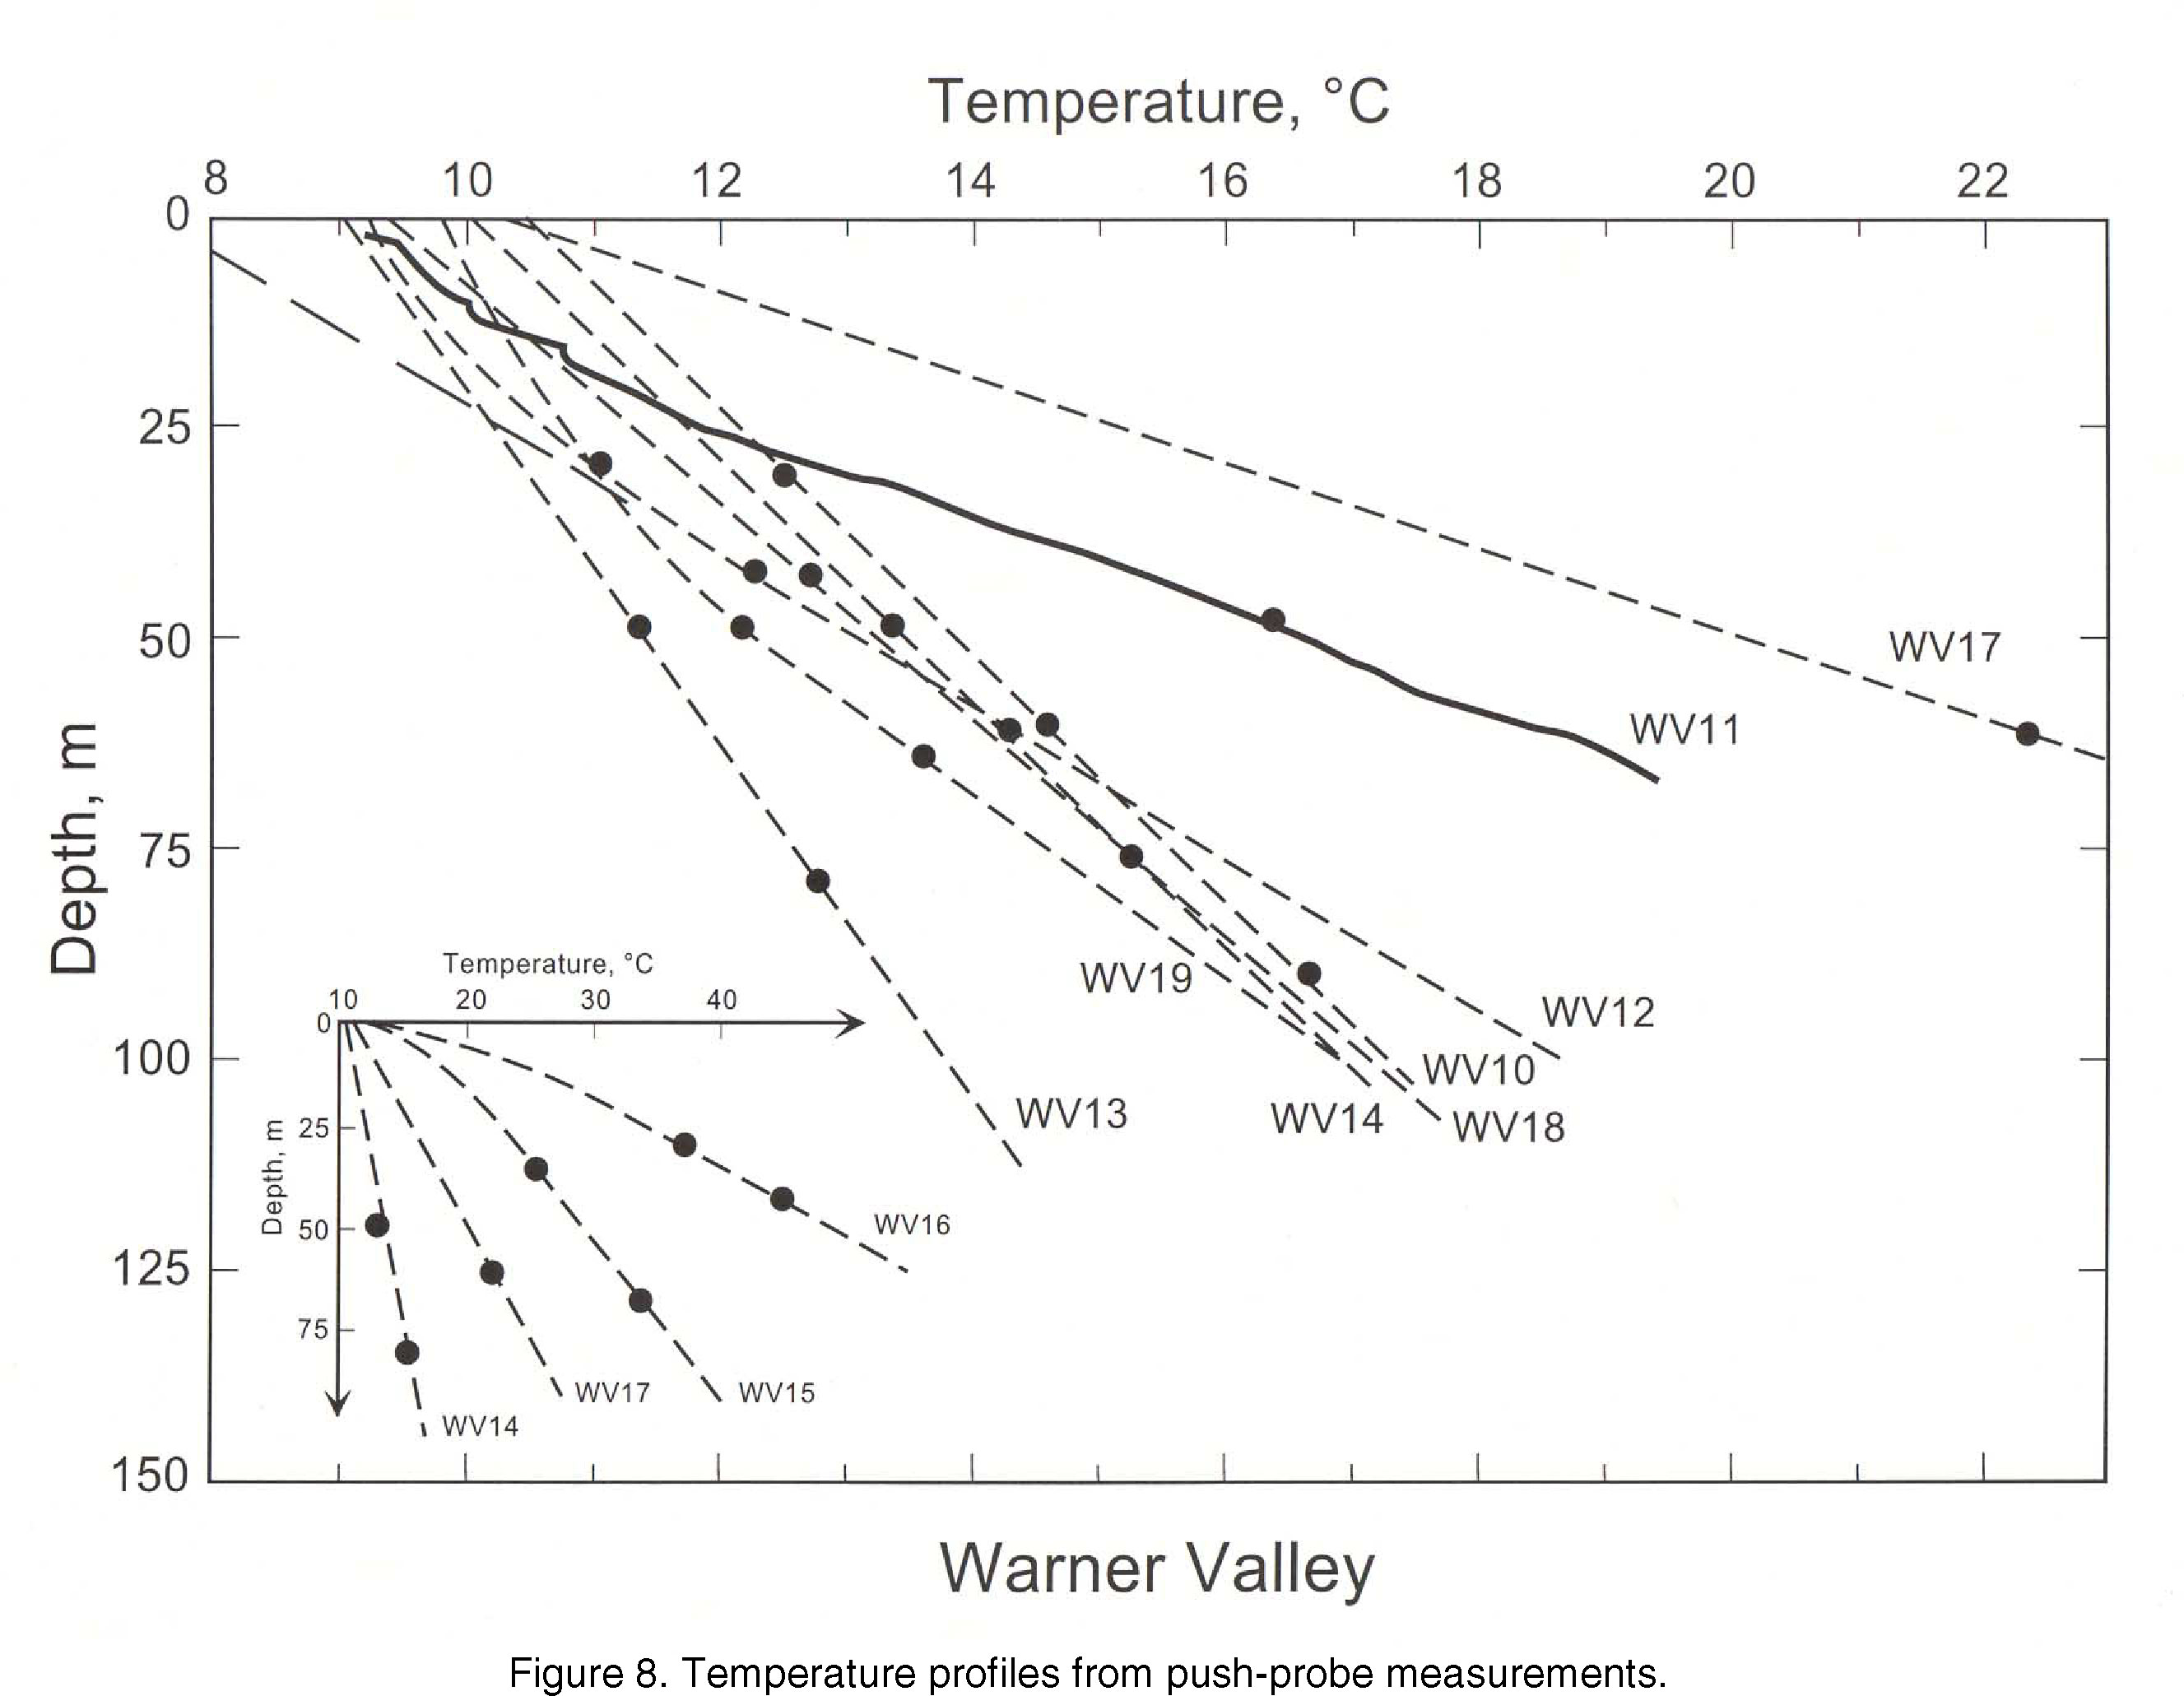
We evaluated the Warner Valley area at the request of the USGS Conservation Division (later the Minerals Management Service of the U.S. Bureau of Land Management). It contained a thermal spring, and was the subject of competitive lease interest, so was considered as a possible Known Geothermal Resource Area (KGRA). This was another area where we deployed the downhole heat-flow probe. The sites and heat-flow values are shown in Figure 6, and the summary of heat-flow determinations is presented as Tables 1c and 1d. In addition to the downhole determinations, 3 observation wells were logged conventionally (Figure 7). Downhole push-probe temperature profiles are shown in Figure 8, and the in situ thermal conductivity histogram, in Figure 9.
Some high heat flows occurred in the vicinity of the thermal spring, but the overall heat flow of the Warner Valley was found to be at or somewhat lower than Basin and Range Background. We concluded that the hot spring and associated high heat flows were a manifestation of a localized convection system in the rocks underlying the playa sediments.
Ruby Valley, Nevada
Table 1e presents heat flow data from an industry report (GTS Job # 3-81, Tables 1 and 2). We have previously reported the temperature data in Sass et al., (1999).
Steamboat Springs, Nevada
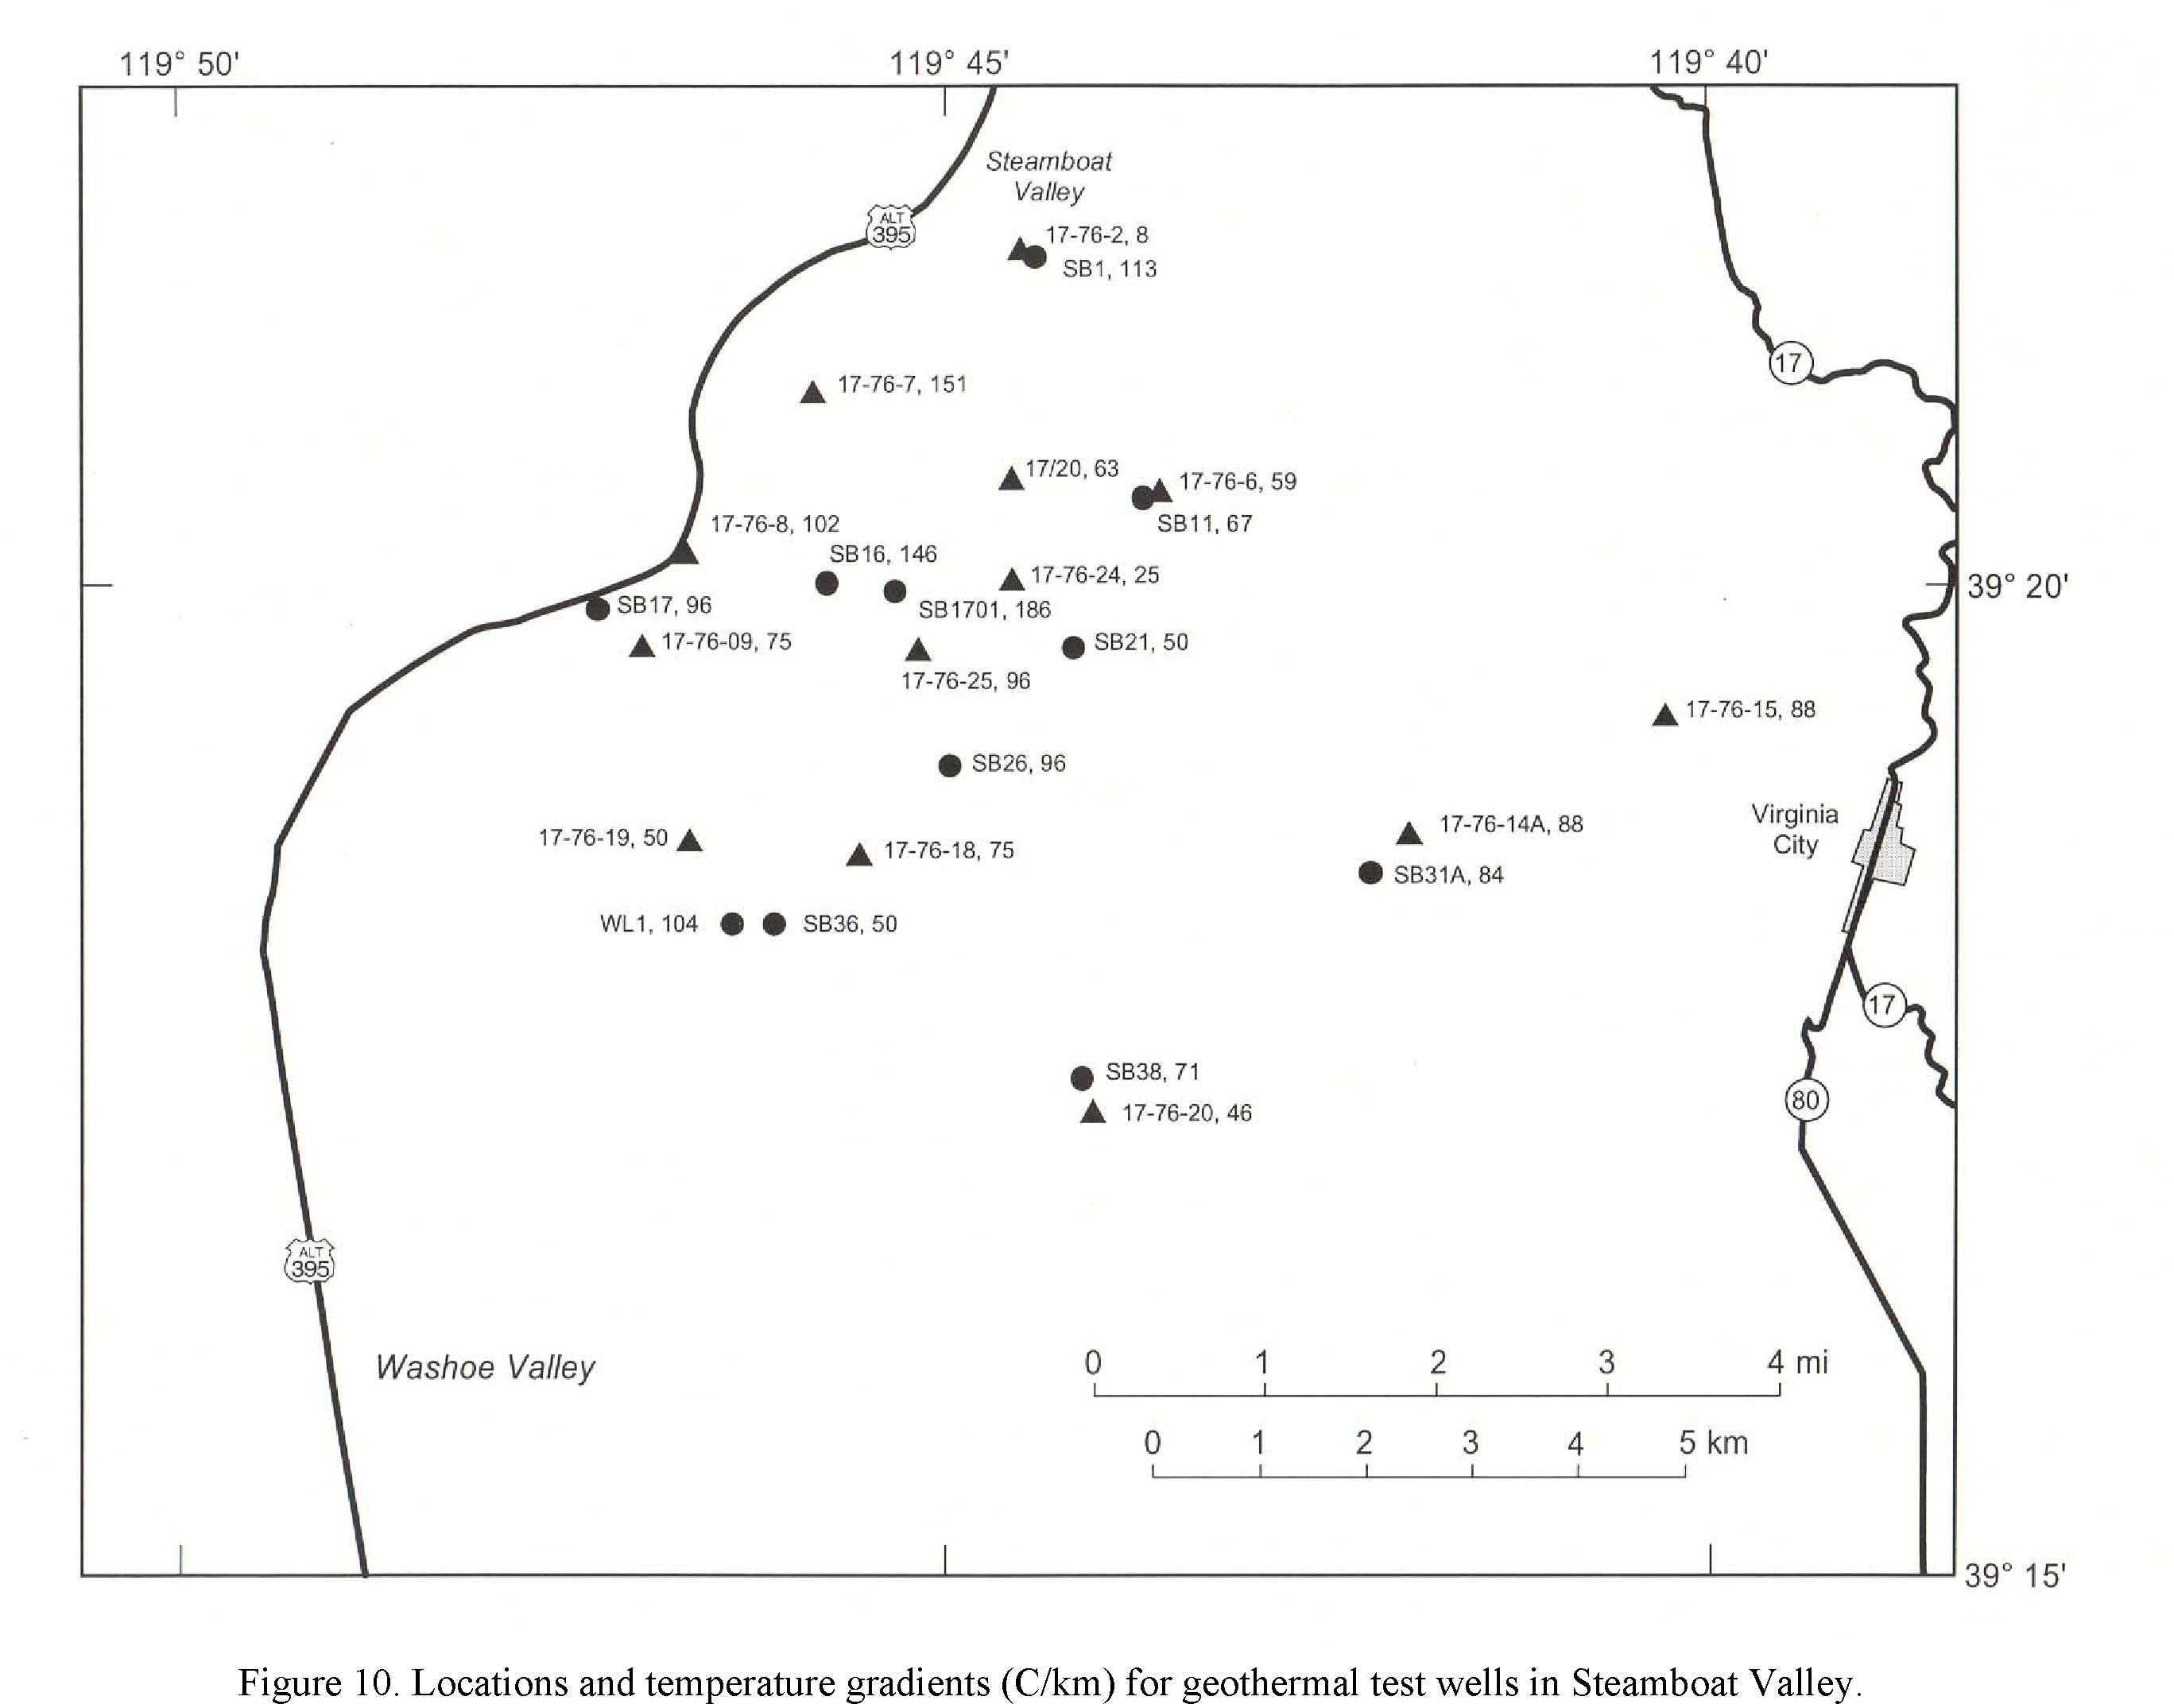
Well sites and heat-flow values are shown in Figure 10. Heat flows from a GTS Report (Job #2-81, Tables 1, 2 and 3) are summarized in Table 1f. As with Ruby Valley, the temperature profiles may be found in Sass et al.,
(1999).
Surprise Valley, California
Temperature profiles presented by Sass et al. (1999) were used by Geo Operator Corp to calculate heat flows, which are presented in Table 1g.
Dixie Valley, Nevada
Heat-flow data were calculated by consultants for 4 of the temperature profiles presented by Sass et al. (1999). Heat flow for these, and additional heat flow from GTS Job No. 40-80 and Williams et al. (1997), are presented in Table 1h.
San Emedio Basin, Nevada
Sass et al. (1999) presented temperature profiles obtained by Chevron Geothermal in the San Emedio Desert. We show in Figure 11, a map of the locations and temperature gradients for geothermal test wells, which also serve as lower limits to the heat flow in these alluvial unconsolidated sediments. The results are tabulated in Table 1i.
Yerington, Nevada
Figure 12 is a map showing the distribution of heat flow in the mining area south and east of Yerington. The data set comprises 6 determinations previously published by Roy (1963) and Sass et al. (1971b), with an additional 3 values obtained after those publications (Table 1j).
Beckwourth Pass, California
Beckwourth Pass is located in the transition between the eastern Sierra Nevada and the western Great Basin. The Beckwourth Peak KGRA was defined by the presence of thermal springs and competitive leasing interest. We were asked to evaluate its geothermal energy potential. The distribution of heat flow is illustrated in Figure 13 and the supporting data for individual heat-flow data in Table 1k.
There is a wealth of temperature-gradient data from industry, government, and academia within the Great Basin (see, eg., Southern Methodist University Geothermal Laboratory or Geothermal Industry Temperature Profiles from the Great Basin). Most of the temperature-gradient observation wells were drilled in unconsolidated sedimentary material making up the playas and alluvial valleys within the Great Basin. Sass and Walters (1999) reviewed these data when interpreting the industry data and found that they fell into 2 remarkably coherent groupings. The averages they adopted were 1.1 W/m K for playa sediments and 1.4 W/m K for alluvial sediments. Previously unpublished conductivities for the Mono Basin and Warner Valley are shown in Figure 4 and Figure 9. Figure 14 shows thermal conductivities measured on both core and cuttings from Grass Valley. The techniques used for the various types of thermal conductivity measurements are detailed in Sass et al. (1971a, b; 1981; 1984a). The averages for various sites in the Western U.S. are summarized in Table 2. Data from the Imperial Valley were originally published by Mase et al., 1981, and by Sass et al., 1984b. San Joaquin Valley conductivities may be found in Sass et al., 1982. The Grass Valley study was by Sass et al., 1977. Mase and Sass (1980) and Sass et al. (1979b) listed the thermal conductivities for the Black Rock Desert. The value of 1.1 for playa sediments is supported by the results in Table 2, but it would appear that a value of approximately 1.65 would be more appropriate for alluvial sediments than the value of 1.4 used by Sass and Walters.
REFERENCES
ACKNOWLEDGEMENTS
Download the Microsoft Excel 2002 database
file
| Accessibility | FOIA | Privacy | Policies and Notices | |
 |
|