USGS Open-File Report 2005-1231
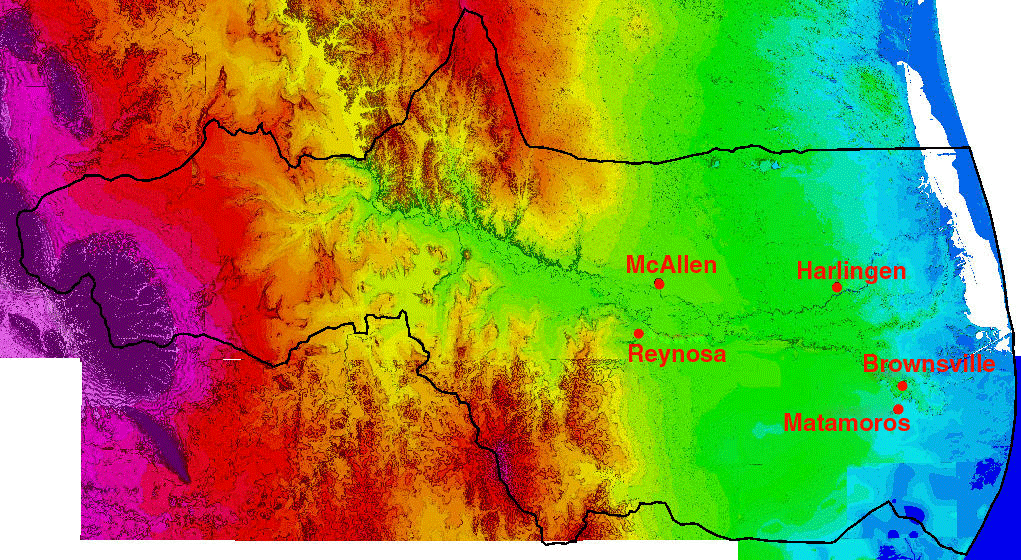
The figure below shows a color-shaded-relief image of digital elevation data for the U.S.-Mexico Border Environmental Health Project. This image was produced using data with a grid cell of 30 m and illumination from the east with a sun angle of 45 degrees and a scale factor of 1.5. Blue colors reflect lower elevations and red colors correspond to higher elevations.
