

Maps of Coastal
Change-Potential: Apostle Islands NL, Indiana Dunes NL, Sleeping Bear Dunes NL,
 |
Methodology
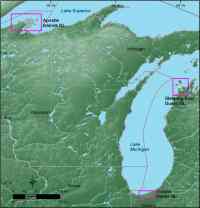 |
| Figure 4. Index map of shoreline grids for Sleeping Bear Dunes NL, Indiana Dunes NL, and Apostle Islands NL. |
In order to develop a database for a park-wide assessment of coastal change-potential, data for each of the six variables mentioned above were gathered from state and federal agencies (Table 2). The database is based on that used by Thieler and Hammar-Klose (1999) and loosely follows an earlier database developed by Gornitz and White (1992). A comparable assessment of the sensitivity of the Canadian coast to sea-level rise is presented by Shaw and others (1998).
The database was constructed using a 1:24,000-scale shoreline for Apostle Islands NL, Indiana Dunes NL, and Sleeping Bear Dunes NL. Data for each of the six variables (geomorphology, shoreline change, coastal slope, relative lake-level change, significant wave height, and annual ice cover) were added to the shoreline attribute table using a 1-minute (approximately 1.5 km) grid (Figure 4,and Figure 5A, Figure 5B, and Figure 5C). Next each variable in each grid cell was assigned a change-potential value from 1-5 (1 is very low change potential, 5 is very high change potential) based on the potential magnitude of its contribution to physical changes on the coast as lake level fluctuates (Table 1).
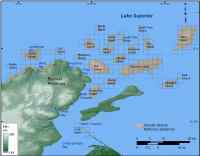
Figure 5A. Shoreline grid for Apostle Islands NL. Each cell is approximately I-minute and represents a shoreline segment for which each variable is defined. Click on figure for larger image. |
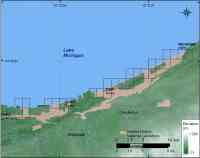
Figure 5B. Shoreline grid for Indiana Dunes NL. Each cell is approximately I-minute and represents a shoreline segment for which each variable is defined. Click on figure for larger image. |
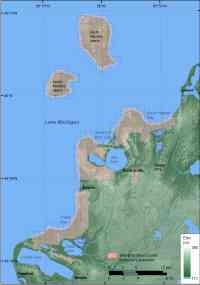
Figure 5C. Shoreline grid for Sleeping Bear Dunes NL. Each cell is approximately I-minute and represents a shoreline segment for which each variable is defined. Click on figure for larger image. |
|
|
