Physical Process Variables
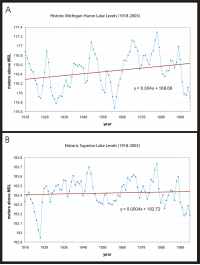 |
| Figure 1. A,B. Hydrographs of Lake Michigan-Huron (A) and Lake Superior (B) from 1918 - 2003. Click on figure for larger image. |
The relative lake-level change variable is derived from the change in annual mean water elevation over time as measured at water level recording stations within the Great Lakes. The rate of lake-level change for Lake Superior from 1918-2003 is about +0.4 mm/year and is ranked as low change-potential (Figure 1B) (GLERL, 2006). The rate of lake-level change for Michigan-Huron for the same time period (1918-2003) is +4.0 mm/year, and is ranked as moderate change-potential (Figure 1A) (GLERL, 2006). A reason for the difference in the historical magnitude of lake-level change between Michigan-Huron and Superior is that since 1914 outflow for Lake Superior has been regulated by the International Lake Superior Board of Control. Because lake levels have historically been rising through the 20th century, but are predicted to fall as a result of changing climate in the 21st century, change-potential was established based on lake level change (rise or fall) instead of only lake level rise (Figure 9A, Figure 9B, Figure 9C). Data from climate models suggest that Michigan-Huron levels could be declining at an average rate of 13 mm/year by 2090, and Superior could fall at a rate of 8 mm/year by 2090 (U.S. Global Change Research Program, 2000). Based on historical data and predictive models, Michigan-Huron tends to have greater lake-level variability than Lake Superior (U.S. Global Change Research Program, 2000). Establishing change-potential ranking based on lake-level change captures the variability in historic and future lake-level trends, and identifies the most dynamic systems as likely being the most vulnerable.
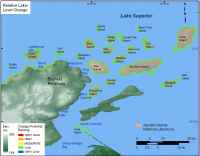
Figure 9A. Rate of relative lake-level change for Apostle Islands National Park. Click on figure for larger image. |
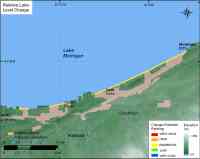
Figure 9B. Rate of relative lake-level change for Indiana Dunes National Park. Click on figure for larger image. |

Figure 9C. Rate of relative lake-level change for Sleeping Bear Dunes National Park. Click on figure for larger image. |
Mean significant wave height is used here as a proxy for wave energy which drives coastal sediment transport. Wave energy is directly related to the square of wave height:
E = 1/8 ρgH2
where E is energy density (wave energy per unit area) , H is wave height, ρ is water density and g is acceleration due to gravity. Thus, the ability to mobilize and transport coastal sediments is a function of wave height squared. In this report, we use hindcast nearshore mean significant wave height data for the Great Lakes for the period 1976-95 obtained from the U.S. Army Corps of Engineers Wave Information Study (WIS) (Hubertz and others, 1996). The model wave heights were compared to historical measured wave height data obtained from the NOAA National Data Buoy Center to ensure that model values were representative of the study area. Mean wave heights for the Apostle Islands NL, Indiana Dunes NL, and Sleeping Bear Dunes NL vary between 0 m (sheltered areas, very low change potential) to over 1 m (exposed areas, very high change potential) (Figure 10a, Figure 10B, Figure 10C).
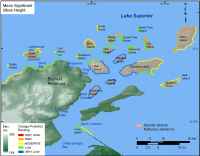
Figure 10A. Mean significant wave heights for Apostle Islands National Lakeshore. The colored shoreline represents the ranked mean significant heights within the park. Click on figure for larger image. |
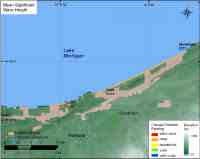
Figure 10B. Mean significant wave heights for Indiana Dunes National Lakeshore. The colored shoreline represents the ranked mean significant heights within the park. Click on figure for larger image. |
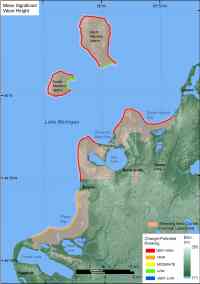
Figure 10C. Mean significant wave heights for Sleeping Bear Dunes National Lakeshore. The colored shoreline represents the ranked mean significant heights within the park. Click on figure for larger image. |
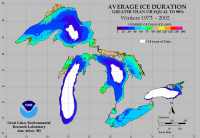 |
| Figure 11. Mean Annual Ice Duration for the Great Lakes for Winters 1973-2002 (Assel, 2003)Click on figure for larger image. |
Mean annual ice cover is linked to the protection from storms that an ice-covered coastline receives during the winter months (Forbes and others, 2004). Ice can also cause severe erosion and property damage especially in river settings or around structures not able to withstand ice push (Forbes and others, 2000). For this study, ice cover over decadal time scales is considered a protective agent in reducing storm erosion along the shoreline. Annual ice cover data were obtained from NOAA's Great Lakes Environmental Research Laboratory Annual Ice Cover Atlas (Assel, 2003) (Figure 11). Of the three national lakeshores in this report, the Apostle Islands experience the longest period of annual ice cover, between 60 and 105 days per year (moderate change-potential). Sleeping Bear Dunes and Indiana Dunes experience between 30-45 days per year of annual ice cover (high change potential) (Figure 12A, Figure 12B, Figure 12C).
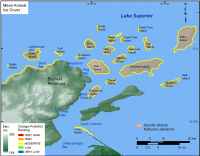
Figure 12A. Mean Annual Ice Cover for Apostle Islands National Lakeshore. Click on figure for larger image. |
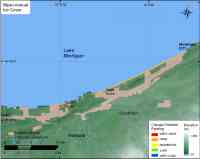
Figure 12B. Mean Annual Ice Cover for Indiana Dunes National Lakeshore. Click on figure for larger image. |
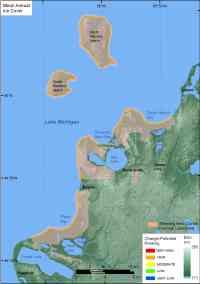
Figure 12C. Mean Annual Ice Cover for Sleeping Bear Dunes National Lakeshore. Click on figure for larger image. |
.