By Michael S. Majewski1, Celia Zamora1, William T. Foreman2, and Charles R. Kratzer1 (1U.S. Geological Survey, Sacramento, California, 2U.S. Geological Survey, Denver, Colorado)
U.S. GEOLOGICAL SURVEY
Open-File Report 2005-1307
ONLINE ONLY
Sacramento, California 2006
Complete
accessible text of report ( 10.8 MB PDF)
To view PDF documents, you
must have the Adobe Acrobat Reader (free from Adobe Systems) installed on
your computer.
(download free
copy of Acrobat Reader).
Abstract
Introduction
Acknowledgements
2001 Sampling (Wet Deposition)
Objectives (2001)
Rain Event: January 26, 2001
2002–2004 Sampling (Wet and Dry Deposition)
Objectives (2002–2004)
2001–2004 Sampling Sites, San Joaquin Valley, California
Analytical Methods
Sampler Types
Wet versus Dry Deposition
Wet Deposition versus Runoff
Detection Frequency in Rainfall
A 3.5-year study was conducted to determine the
signifcance of atmospheric deposition to the pesticide concentrations in runoff.
Both wet and dry atmospheric depostion were collected at six sites in the central
San Joaquin Valley, California. Wet deposition samples were collected during
individual rain events and dry deposition samples were collected for periods
ranging from three weeks to four months. Each sample was analyzed for 41 currently
used pesticides and 23 transformation products, including the oxygen analogs
of nine organophosphorus (OP) insecticides. Ten compounds in rainfall and 19
in dry deposition were detected in at least 50% of the samples. The herbicides
dacthal, pendimethalin, simazine, and trifluralin, and the insecticides carbaryl,
chlorpyrifos, and diazinon, were the most frequently detected pesticides in
both rainfall and dry deposition. The oxygen analog concentrations (maximum/median)
of chlorpyrifos (1.83/0.213 micrograms/Liter [µg/l], n = 70) and diazinon
(2.74/0.327 µg/L, n = 50) in rainfall were at times equivalent to or greater
than the parent concentrations. A comparison of the depositional amounts (micrograms
per square meter) showed that the magnitude of dry deposition could be as much
as 40% higher than wet deposition for some pesticides and that the predominant
depositional phase was related to the physical and chemical properties of the
pesticide. In a small urban watershed, however, 68% of the diazinon in the runoff
could be attributed to rainfall. The more water soluble pesticide—carbaryl,
metolachlor, napropamide, and simazine—also showed this trend. Malathion was
detected in the runoff water, but not in any rainfall sample. Chlorpyrifos,
dacthal, pendimethalin, and trifluralin, compounds with water solubilities less
than 1.25 x 10⁻³ moles/m3 and log soil sorbtion coefficient
(Koc) values of greater than 2.2, had higher rainfall concentrations
than the runoff water and were presumed to be partitioning onto the suspended
sediments and organic matter on the ground.
The atmosphere is an important component of the hydrologic cycle that is often overlooked in many pesticide environmental fate studies. Pesticides have been recognized as potential air pollutants since the mid-1940s. Numerous studies have documented how pesticides drift off-site during and after the application process. Other studies have documented the processes that govern pesticide movement and distribution in the environment (Majewski and Capel, 1995).
During and after their application, many pesticides move off the intended target area and can contaminate local rivers and streams. Atmospheric deposition of pesticides is most likely to affect stream water quality during runoff events when precipitation and direct surface runoff are the major sources of streamflow. Locally high concentrations of pesticides in rain and air are seasonal, are correlated to local use, and usually occur during the spring and summer. However, high concentrations of OP pesticides also can occur in rain, air, and fog during the fall and winter in areas such as the stone-fruit orchards in California’s Central Valley. Diazinon and chlorpyrifos are among the OP insecticides that are detected most often in the air, rain, and fog in this region of the Central Valley.
Historically, chemical and bioassay monitoring of surface water have shown that pesticides in the San Joaquin River can occur at concentrations that are toxic to sensitive aquatic organisms. Toxicity appears to be caused by pesticides in storm runoff, irrigation tail water, runoff from orchards, and urban runoff (Kuivila and Foe, 1995).
Section 303(d) of the Clean Water Act requires states to identify waters that do not or are not expected to meet applicable water-quality standards with technology-based control alone. The Act also requires states to establish a priority ranking for waters on the 303(d) list of impaired waters and to establish Total Maximum Daily Loads (TMDLs) for those listed waters. Essentially, a TMDL is a planning and management tool intended to identify, quantify, and control the sources of pollution within a given watershed to the extent that water-quality objectives are achieved, and the beneficial uses of water are fully protected. The lower San Joaquin River is listed in California’s Clean Water Act Section 303(d) of impaired waters because of elevated concentrations of chlorpyrifos and diazinon.
The two studies presented here are part of a larger U.S. Geological Survey program designed to identify all sources of pesticides in the San Joaquin River watershed. The results will be used by the California Regional Water Quality Control Board to evaluate the current Best Management Practices (BMPs); and the BMPs will be modi?ed where necessary to reduce OP pesticide loading in surface waters in the San Joaquin River.
The California Department of Pesticide Regulation and the California Regional Water Quality Control Board provided funding for this study. Connie Clapton and Henry Miyashita (USGS) helped to collect and process samples for this study. Serena Skaates, James Madsen, Max Stroppel, and Frank Wiebe (USGS National Water Quality Laboratory) helped in methods development and sample analysis. Jo Ann Gronberg and Donna Knifong (USGS) assisted with poster design and preparation.

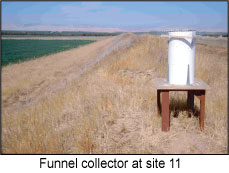
32-cm diameter Teflon-lined or stainless steel funnels were placed at each sampling site for no more than 24 hours before a rain event occurred. The samples were collected within 24 hours of the end of the event. The funnels were placed on cleaned, 1-gal amber glass solvent bottles, and the funnel-bottle assembly was supported by an appropriate length of plastic irrigation pipe attached to a small wooden table. The autosamplers used 27-cm diameter stainless steel buckets.
Chicken wire covered each funnel to intercept large debris, birds, and other wildlife from entering the collection area. The funnels were exposed to the atmosphere from three weeks to several months. At collection, the wire screen was removed, and about 50 mL of organic free water from a squeeze bottle was used to rinse deposited material off the sides of the funnel, followed by a rinse using about 50 mL of a 50:50 mixture of hexane:ethyl acetate. All the rinses were collected in the 1-gal amber glass solvent bottle that the funnel rested on and drained in to.

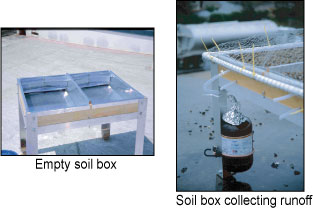
Each soil box was about 1-m square and divided in half down the center. The inside of each section was lined with aluminum sheeting and filled with a composite mixture of soil taken from each of the six sampling locations. Each sampler was set up in a north-south orientation and inclined slightly in the southerly direction to facilitate surface runoff. The runoff, both rainfall and suspended soil, was collected in a clean 1-gal amber glass bottle secured to one of the sampler legs. Four times during the study, surficial soil samples were taken from one side of the sampler and analyzed for the same suite of pesticides as in the rain. No runoff samples were ever collected from this side. The soil in the side where the runoff was collected was left undisturbed for the duration of the study. Soil box runoff samples were collected after each rain event that had sufficient intensity and volume to produce surficial runoff. These samples were filtered, and both the filtrate and filter were sent to the laboratory for analysis.
The method used for rain and surface-water samples determined a subset of 41 parent pesticides and 23 pesticide degradates isolated onto a 0.5-g C-18 solid phase extraction (SPE) cartridge, then eluted with 2 mL of ethyl acetate. The samples were analyzed by GC/EIMS operated in the selected ion monitoring (SIM) mode as described in Sandstrom and others (2001). The analyses included selected analytes described in Zaugg and others (1995).
Dry or bulk deposition samples were shake-extracted with (1) 30% ethyl acetate
(EtOAc) in hexane in a separatory funnel or (2) dichloromethane (DCM) in the
sample bottle(s) followed by DCM isolation by pouring through a Teflon (DryDisk)
membrane. All extracts were dried using Na2SO4 and concentrated
by Kuderna-Danish (K-D) distillation and nitrogen gas evaporation to 0.5–1.0
mL. Extracts were introduced to either (a) stacked 0.5-g C-18 silica over 1-g
Florisil SPE columns eluted with 6 mL ethyl acetate or (b) a 0.5-g graphitized
carbon SPE column eluted with 13 mL 50% DCM/EtOAc. Extracts were concentrated
by micro-K-D and solvent exchange to toluene. Three perdeuterated PAH internal
injection standards were added during N2 evaporation to 0.5 mL final volume.
Extracts were analyzed by GC/EIMS-SIM for 64 pesticides and degradates using
conditions given in Sandstrom and others (2001). Suspended sediment samples
were extracted using three 10-minute static cycles with 25% acetone/DCM at 100oC
under pressurized conditions. Extracts were subsequently prepared and analyzed
similarly to the dry deposition samples with graphitized carbon SPE cleanup.
To collect rainfall samples at urban and agricultural locations in the Modesto area during the orchard dormant spray season (January through February 2001) and to collect runoff samples from an urban storm drain during a rain event.
Four urban and four agricultural sites were located throughout the Modesto study area. The urban sites were located throughout the Modesto metropolitan area—downtown (site 8), an industrial area (site 5), a new residential development (site 4), and an established residential area (site 6). These sites were selected to include a variety of urban land uses and to show the occurrence and distribution of the pesticide content in rainfall.
Four agricultural sites were located at the four compass points surrounding the Modesto metropolitan area. Three of the sites were in areas where the predominant land use is orchards—sites 2, 3, and 9. Site 1 was located where the predominant land use is alfalfa. All the agricultural sites, with the exception of site 2, were located away from orchards to minimize any direct in?uence.
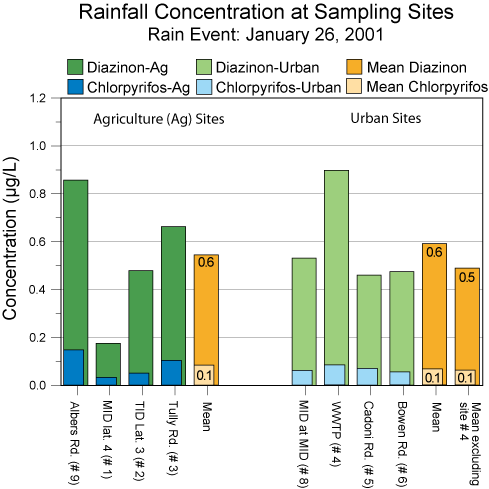
Rain Event: January 26th 2001
Only one signifcant rainfall event occurred during the 2001 sampling time frame. The storm event on January 26 was a frontal system that moved into the study area from the southwest. The average event rainfall at all sites was about 1.3 cm.
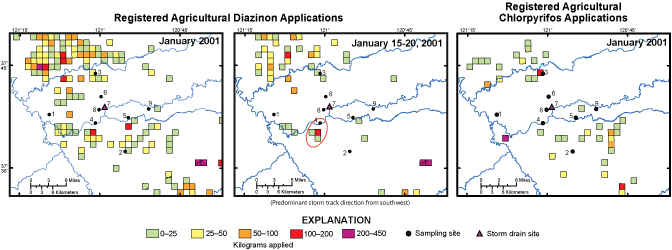
The concentrations of chlorpyrifos or diazinon at each urban sampling site were similar, with the exception of concentrations at site 4, which were substantially higher. This site, however, was downwind of a major diazinon application the previous week, which probably influenced the results (see encircled area below).
The chlorpyrifos and diazinon results for the agricultural sites were highly variable and reflected their proximity to orchards and local dormant spray operations (See diazinon and chlorpyrifos application area maps below).
The mean chlorpyrifos and diazinon concentrations at the urban and the agricultural sites were nearly equivalent, indicating that the overall atmospheric burden in the region was fairly similar during this event, even though the concentrations at the agricultural sites were variable. It is unknown how much, if any, urban applications occurred in January and if they influenced the results.
Hourly runoff water samples were collected throughout the event at one storm drain located at the bottom of a small urban watershed (site 7). These samples were filtered and then analyzed for the same constituents as the rainfall samples (see Methods Section for analytical details and references).
When comparing the mean concentrations in rainfall (sites 6 and 8 were used) to those in the runoff, it was found that the rainfall contributed 68% of the diazinon in the runoff, whereas the chlorpyrifos concentration in the rainfall was 2.5 times higher than in the runoff. These results can be explained using the physical and chemical properties of these insecticides. Since the runoff samples were filtered, and the filters were not analyzed, it can be concluded that most of the chlorpyrifos had been sorbed onto the suspended particulate matter. This behavior was also seen for the several other pesticides detected in both the rain and runoff samples, such as dacthal, pendimethalin, and trifluralin.
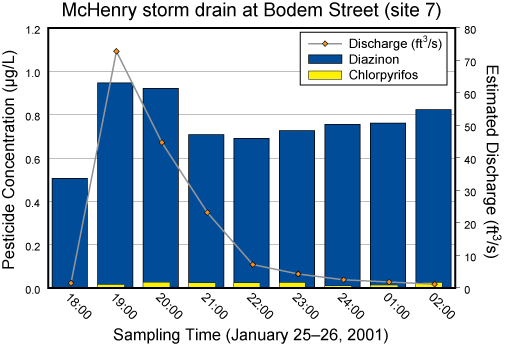
68% concentration in runoff can be attributed to rainfall
More water soluble
Less sorption to organic matter
Concentration in rain was 2.5 times higher than in runoff
Less water soluble
More sorption to organic matter
| Diazinon | Chlorpyrifos | |
| SL (mole/m3) | 0.197 |
0.0031 |
| PL (Pa) | 0.008 |
0.003 |
| log Koc | 2.7 to 3.27 | 3.7 to 4.13 |
| Mean Rain (Sites 6 & 8) (µg/L) |
Mean Runoff (µg/L) |
SL (mole/m3) |
|
| Carbaryl | 0.082 | 0.176 |
2.53 |
| Dacthal | 0.011 |
0.005 |
0.0306 |
| Malathion | 0.007 |
0.049 |
0.264 |
| Metolachlor | 0.004 |
0.009 |
1.87 |
| Napropamide | 0.024 |
0.023 |
0.849 |
| DDE | 0.003 |
0.002 |
0.00055 |
| Pendimethalin | 0.149 |
0.077 |
0.00218 |
| Simazine | 0.051 |
0.062 |
2.52 |
| Trifluralin | 0.025 | 0.007 | 0.00244 |
(PL , subcooled liquid phase vapor pressure; SL , water solubility; Koc , soil absorbtion coefficient)
To provide a better determination of the contribution of atmospheric deposition, both wet (precipitation) and dry (gaseous and particle), of airborne organophosphorus insecticides and other pesticides to the overall pesticide loading to the San Joaquin River (SJR) area.
In 2002, the sampling sites were changed and distributed over a larger study area. The two sampling sites with autosamplers (sites 8 and 9) were retained. Teflon-lined funnels were located at two sites on the west side of the SJR in predominantly mixed agricultural areas—row crops and orchards (sites 10 and 11); at one site in a rural residential area (site 12), and another at a small rural airport (site 13). Dry as well as wet deposition were collected using the same sampler.
Soil boxes were added to two sites to compare the following: the pesticide
concentrations in rainfall with that of runoff from soil; the concentrations
in runoff with those on the surface soil mobilized by the rainfall runoff (suspended
sediment); and the concentrations on dry deposition collected on the soil (a
more natural collection surface) with those of the funnels.
| Concentration | |||
| Total Maximum (µg/L) | Total Mean (µg/L) | Total % Hits (n=137) |
|
| Dacthal | 0.030 | 0.011 | 100% |
| Simazine | 6.740 | 0.177 | 99% |
| Diazinon | 2.220 | 0.149 | 93% |
| Chlorpyrifos | 0.831 | 0.051 | 89% |
| Pendimethalin | 0.455 | 0.056 | 88% |
| Trifluralin | 0.039 | 0.010 | 78% |
| Carbaryl | 0.756 | 0.048 | 68% |
| Myclobutanil | 0.898 | 0.087 | 65% |
| Metolachlor | 0.190 | 0.012 | 60% |
| Iprodione | E 21 | 1.903 | 53% |
| Malathion | 0.383 | 0.031 | 43% |
| Prometryn | 0.231 | 0.024 | 42% |
| Diazinon OA | 0.300 | 0.041 | 39% |
| Methidathion | 0.317 | 0.043 | 39% |
| 3,4-Dichloroaniline | 0.354 | 0.039 | 39% |
| Chlorpyrifos OA | 0.150 | 0.026 | 35% |
| Malathion OA | 0.674 | 0.050 | 34% |
| Pronamide | 0.054 | 0.012 | 28% |
| 1-Naphthol | 0.050 | 0.014 | 26% |
| Azinphos-methyl | 0.322 | 0.043 | 26% |
| Phosmet | 0.049 | 0.015 | 20% |
| Methyl parathion | 0.194 | 0.044 | 17% |
| 4-Chloro-2-methylphenol | 0.018 | 0.004 | 16% |
| Dichlorvos | 0.030 | 0.013 | 10% |
| Metribuzin | 0.790 | 0.082 | 9% |
| Dimethoate | 0.102 | 0.036 | 5% |
| cis-Permethrin | 0.006 | 0.005 | 3% |
| Alachlor | 0.006 | 0.004 | 2% |
| Atrazine | 0.081 | 0.034 | 2% |
| Metalaxyl | 0.034 | 0.020 | 2% |
| Methyl parathion OA | 0.020 | 0.017 | 2% |
| Cyfluthrin | 0.017 | 0.015 | 1% |
| Cypermethrin | 0.011 | 0.011 | 1% |
| Phosmet OA | 0.010 | 0.010 | 1% |
| Azinphos-methyl OA | 0.010 | 0.010 | 1% |
| Benfluralin | 0.005 | 0.005 | 1% |
| Desulfinyl Fipronil | 0.022 | 0.022 | 1% |
| 2-Chloro-2’,6’-diethylacetanilide | ND | ND | 0% |
| 2-Chloro-4-isopropylamino-6-amino-s-triazine | ND | ND | 0% |
| 2-Ethyl-6-methylaniline | ND | ND | 0% |
| 2-[(2-Ethyl-6-methylphenyl)-amino]-1-propanol | ND | ND | 0% |
| 2,6-Diethylaniline | ND | ND | 0% |
| Acetochlor | ND | ND | 0% |
| Desulfinylfipronil amide | ND | ND | 0% |
| Dicrotophos | ND | ND | 0% |
| Dieldrin | ND | ND | 0% |
| Ethion | ND | ND | 0% |
| Ethion monoxon | ND | ND | 0% |
| Fenamiphos | ND | ND | 0% |
| Fenamiphos sulfone | ND | ND | 0% |
| Fenamiphos sulfoxide | ND | ND | 0% |
| Fipronil | ND | ND | 0% |
| Fipronil sulfide | ND | ND | 0% |
| Fipronil sulfone | ND | ND | 0% |
| Fonofos | ND | ND | 0% |
| Fonofos OA | ND | ND | 0% |
| Isofenphos | ND | ND | 0% |
| Phorate | ND | ND | 0% |
| Phorate OA | ND | ND | 0% |
| Prometon | ND | ND | 0% |
| Tebuthiuron | ND | ND | 0% |
| Terbufos | ND | ND | 0% |
| Terbufos OA sulfone | ND | ND | 0% |
| Terbuthylazine | ND | ND | 0% |
E = estimated value; ND = not detected
Red data denotes compounds detected at a frequency greater than 50%;
blue denotes a range of 1 to 49%; black refers to nondetections.
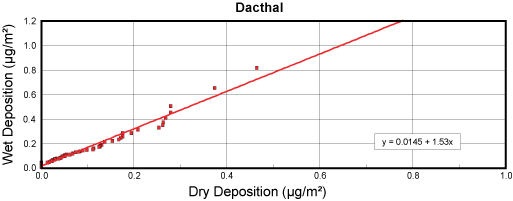
Graphs show the relative importance of wet versus dry deposition during the study period. For those compounds with low Henry’s law (H) values, such as diazinon, rainfall was a more significant source of depositional loading to the ground than dry deposition. For those compounds with high Henry’s law values, such as chlorpyrifos, dry deposition is more important. Dacthal has a Henry’s law value between diazinon and chlorpyrifos, and both wet and dry deposition are nearly equivalent.
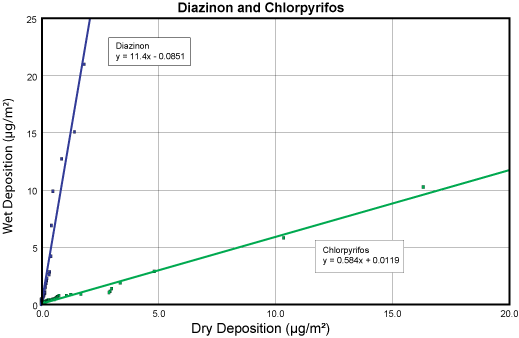
| PL (mPa) | SL (mol/m³) | H (Pa m³/mol) | log Koc | |
| Chlorpyrifos | 3.34 | 0.00307 | 1.1 | 3.78 |
| Diazinon | 8.0 | 0.197 | 0.04 | 2.76 |
| Dacthal | 14.5 | 0.0015 | 0.219 | 3.75 |
Values at 25°C |
||||
(PL , subcooled liquid phase vapor pressure; SL , water solubility; Koc , soil absorbtion coefficient; H, Henry’s law value)
Chlorpyrifos |
Chlorpyrifos OA |
Diazinon |
Diazinon OA |
Dacthal |
||||||||||||||||
| Sampling Date | Sampler | Total Sample Volume (mL) | Sample Type | Calculated Rainfall (inches) | Wet conc (µg/L) | Wet Dep (µg/m²) | Soil Box SS (µg/mg) | Wet conc (µg/L) | Calculated Wet Dep (µg/m²) |
Soil Box SS (µg/mg) | Wet conc (µg/L) | Calculated Wet Dep (µg/m²) |
Soil Box SS (µg/mg) | Wet conc (µg/L) | Calculated Wet Dep (µg/m²) |
Soil Box SS (µg/mg) | Wet conc (µg/L) | Calculated Wet Dep (µg/m²) |
Soil Box SS (µg/mg) | |
Urban Site 8 |
14-Jan-03 | Funnel |
910 | Rain - Funnel | 0.47 | 0.072 | 0.897 | 0.010 | 0.125 | 0.962 | 11.981 | 0.070 | 0.872 | 0.008 | 0.100 | |||||
| 14-Jan-03 | AS |
660 | Rain - AS | 0.47 | 0.052 | 0.559 | ND | 1.180 | 12.685 | 0.120 | 1.290 | 0.013 | 0.140 | |||||||
| 14-Jan-03 | Soil Box |
660 | Soil Runoff | NA | 0.039 | ND | 0.304 | 0.040 | 0.009 | |||||||||||
| 14-Jan-03 | SB Filter |
660 | Runoff - Filter | NA | 22.5 | ND | 24.3 | ND | 11.1 | |||||||||||
| 18-Mar-03 | Funnel |
2240 | Rain - Funnel | 1.16 | 0.061 | 1.870 | 0.030 | 0.920 | 0.081 | 2.483 | ND | 0.018 | 0.552 | |||||||
| 18-Mar-03 | AS |
1800 | Rain - AS | 1.27 | 0.033 | 0.967 | 0.010 | 0.246 | 0.066 | 1.935 | 0.010 | 0.293 | 0.014 | 0.410 | ||||||
| 18-Mar-03 | Soil Box |
210 | Soil Runoff | NA | 0.061 | ND | 0.100 | 0.013 | ||||||||||||
| 18-Mar-03 | SB Filter |
210 | Runoff - Filter | NA | ND | ND | 52.8 | ND | ND | |||||||||||
| 16-Dec-03 | Funnel |
810 | Rain - Funnel | 0.42 | 0.013 | 0.144 | ND | 0.032 | 0.355 | ND | 0.008 | 0.089 | ||||||||
| 16-Dec-03 | AS |
370 | Rain - AS | 0.26 | 0.023 | 0.139 | ND | 0.064 | 0.386 | 0.050 | 0.253 | 0.008 | 0.048 | |||||||
| 16-Dec-03 | Soil Box |
120 | Soil Runoff | NA | 0.053 | ND | 0.101 | ND | 0.031 | |||||||||||
| 16-Dec-03 | SB Filter |
120 | Runoff - Filter | NA | ND | ND | ND | ND | ND | |||||||||||
Agricultural Site 9 |
14-Jan-03 | Funnel |
1200 | Rain | 0.62 | 0.458 | 7.522 | 0.020 | 0.328 | 0.879 | 14.436 | 0.060 | 0.985 | 0.004 | 0.066 | |||||
| 14-Jan-03 | AS |
860 | Rain | 0.61 | 0.601 | 8.418 | 0.010 | 0.140 | 0.834 | 9.816 | 0.040 | 0.560 | 0.005 | 0.059 | ||||||
| 14-Jan-03 | Soil Box |
1070 | Soil Runoff | 0.544 | ND | 1.620 | 0.090 | 0.005 | ||||||||||||
| 14-Jan-03 | SB Filter |
1070 | Soil Runoff | 258 | ND | 92.1 | ND | 6.3 | ||||||||||||
| 8-Apr-03 | Funnel |
1410 | Rain - Funnel | 0.73 | 0.020 | 0.386 | ND | 0.017 | 0.328 | ND | 0.007 | 0.135 | ||||||||
| 8-Apr-03 | AS |
1400 | Rain - AS | 0.99 | 0.014 | 0.319 | ND | 0.016 | 0.365 | 0.010 | 0.228 | 0.007 | 0.160 | |||||||
| 8-Apr-03 | Soil Box |
475 | Soil Runoff | NA | 0.017 | ND | 0.042 | ND | 0.013 | |||||||||||
| 8-Apr-03 | SB Filter |
475 | Runoff - Filter | ND | ND | 17.4 | ND | ND | ||||||||||||
| 16-Dec-03 | Funnel |
760 | Rain - Funnel | 0.40 | 0.015 | 0.156 | ND | 0.060 | 0.624 | 0.030 | 0.312 | 0.007 | 0.073 | |||||||
| 16-Dec-03 | AS |
670 | Rain - AS | 0.47 | 0.012 | 0.131 | ND | 0.059 | 0.644 | ND | 0.007 | 0.076 | ||||||||
| 16-Dec-03 | Soil Box |
640 | Soil Runoff | NA | 0.015 | ND | 0.096 | 0.020 | 0.011 | |||||||||||
| 16-Dec-03 | SB Filter |
640 | Runoff - Filter | NA | ND | ND | 19.2 | ND | ND | |||||||||||
| AS = Autosampler Conc = Concentration Dep = Deposition ND = Not detected SB = Soil box SS=Suspended sediment NA or blank cell = Not applicable or data not available | ||||||||||||||||||||
| Columns are colored for ease of readability. | ||||||||||||||||||||
The comparability of pesticide concentrations in rainfall samples collected using the Funnel and Autosampler were generally good, although the total volume of rainfall collected by each sampler was often different. The same pesticides detected in rainfall usually were detected in the soil-runoff water, with a few exceptions. The pesticide concentrations in the soil box runoff water were generally similar to those in the rainfall. Very few pesticides were detected on the soil box suspended sediments.
Kuivila, K.M., and Foe, C.G., 1995, Concentrations, transport, and biological effects of dormant spray pesticides in the San Francisco estuary, California: Environmental Toxicology and Chemistry, v. 14, no. 7, p. 1141-1150.
Majewski, M.S., and Capel, P.D., 1995, Pesticides in the atmosphere: distribution, trends, and governing factors: Pesticides in the Hydrologic System: Chelsea, Mich., Ann Arbor Press, Inc., 4 v., v. 1, 250 p.[Available from CRC Press, Boca Raton, Fla.]
Sandstrom, M.W., Stroppel, M.E., Foreman, W.T., and Schroeder, M.P., 2001, Methods of analysis by the U.S. Geological Survey National Water Quality Laboratory–Determination of moderate-use pesticides and selected degradates in water by C-18 solid-phase extraction and capillary-column gas chromatography/mass spectrometry with selected-ion monitoring (methods 2002/2011): U.S. Geological Survey Water-Resources Investigations Report 01-4098, 70 p.
Zaugg, S.D., Sandstrom, M.W., Smith, S.G., and Fehlberg, K.M., 1995, Methods of analysis by the U.S. Geological Survey National Water Quality Laboratory–Determination of pesticides in water by C-18 solid phase extraction and capillary-column gas chromatography with selected-ion monitoring: U.S. Geological Survey Open-File Report 95-181, 49p.
Mackay, D., Shiu, W.Y., and Ma, K.C., 1997, Illustrated handbook of physical-chemical properties and environmental fate for organic chemicals–Pesticide chemicals: Boca Raton, Fla., Lewis Publishers, v. 5, 812 p.
U.S. Department of Agriculture, 2003, The ARS Pesticide Properties Database: Agricultural Research Service, Beltsville, Md., accessed November 10, 2004, at http://www.arsusda.gov/acsl/services/ppdb/.
Donnelly, J.R., Drewes, L.A., Johnson, R.L., Mulslow, W.D., Knapp, K.K., and
Sovocool, G.W., 1990, Purity and heat of fusion data for environmental standards
as determined by differential scanning calorimetry: Thermochimica Acta, v. 167,
p. 155-187.
OF 2005-1307
Document Accessibility: Adobe Systems Incorporated has information about PDFs and the visually impaired. This information provides tools to help make PDF files accessible. These tools convert Adobe PDF documents into HTML or ASCII text, which then can be read by a number of common screen-reading programs that synthesize text as audible speech. In addition, an accessible version of Acrobat Reader 5.0 for Windows (English only), which contains support for screen readers, is available. These tools and the accessible reader may be obtained free from Adobe at Adobe Access.
| AccessibilityFOIAPrivacyPolicies and Notices | |
 |
|