U.S. Geological Survey Open-File Report 2005-1428
Digital Mapping Techniques '05—Workshop Proceedings
The cities of the Puget Lowland region (Figure 1) have been built atop a complex sequence of deposits with widely varying engineering strengths and an irregular bedrock surface at depth. They lie in one of the most seismically active regions of North America, with moderate earthquakes virtually assured during the lifetime of any structure, most recently the Nisqually earthquake of 2001. Many contain steep hillslopes that are marginally stable in wet weather; because of shallow water tables, underlying sandy deposits are particularly susceptible to liquefaction during strong ground shaking. As the center of both population and economic activity of the Pacific Northwest, geologic events of even moderate intensity can and do result in substantial human and economic losses. Seattle was recognized by Federal Emergency Management Agency (FEMA) in 2000 as the city with the seventh-highest annualized earthquake loss in the United States, and the highest outside of California. At the state level, Washington has the second highest risk (2nd only to California) of suffering economic loss due to earthquakes.
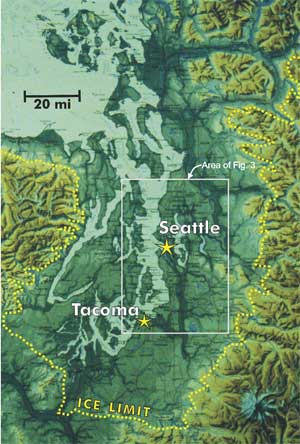
Figure 1. Location map of the Puget Lowland region, showing the southern extent of the Puget lobe of the Cordilleran ice sheet about 16,000 calendar years ago (dashed line; Booth and others, 2004)
Geoscientists and engineers recognize that the Quaternary deposits of the Puget Lowland are primary determinants of the magnitude and location of strong ground shaking. Knowledge of the geometry and variability of these depositsthe geologic frameworkis critical to the support of ongoing seismic evaluations across this region, which will ultimately determine the necessary measures, and the cost, of adequate preparation and hazard mitigation. Such a framework comprises a detailed representation of the sequence, chronology, structural history, distribution, lateral lithologic variability, and geotechnical properties (such as strength and permeability) of geological materials.
The Pacific Northwest Center for Geologic Mapping Studies (http://geomapnw.ess.washington.edu) is a collaborative effort to develop new data and greater understanding of the geology of the central Puget Lowland. The project was initiated in 1998 through collaboration with the U.S. Geological Survey, the University of Washington, and the City of Seattle, to provide state-of-the-art geologic data to support geologic hazard mitigation in the City. Since that beginning, its scope has broadened to include other geographic areas and a broadened range of research topics. The project goals are to acquire existing geologic data and create new geologic information; to conduct geologic research and produce new geologic maps; and to support the wide variety of additional research, hazard assessments, and land-use applications of other scientists, organizations, and agencies throughout the region.
Our efforts to improve the regional understanding of western Washingtons geologic framework consist of several interrelated elements:
Geologic investigations in urban areas, regardless of location, all face the same quandarythe value and potential applicability of the data are high, but the same human infrastructure that makes these data so valuable also obscures the very source of that information. Fortunately, that infrastructure also creates some of the most valuable geologic data to be found in urban areas, namely subsurface explorations. Although abundant, most of these exploration data are widely scattered and poorly organized in building and utility departments, transportation agencies, and private consulting firms. To be able to take full advantage of these data, we have developed and are continuing to populate a GIS-based relational database to efficiently store, manipulate, and display the vast amount of subsurface geologic data available for the Seattle area. Geologic data from tens of thousands of field explorations, exposures, and excavations have been entered into the database and are now accessible and available to a much wider audience than ever anticipated.
Partnerships have been formed with a number of local public agencies (such as building departments, public utilities, port authorities, transportation agencies, and natural resource departments) both to acquire the raw data from geologic and geotechnical studies and to return the populated database and GIS interface to those agencies and the public. As a result of continued partnerships over the past seven years, we have developed and streamlined processes for identifying and acquiring geologic data from a variety of sources, with our data largely obtained from public-agency, reports, permit files, and other records.
A basic three-level structure was adopted for the database to provide a common framework for all data and to allow for future expansion (Figure 2). Information about the document (i.e. the physical report for a property, a structure, or other type of project) that contains the geologic data and its spatial coverage are stored at the first level (in the GEOTECH_DOC table in Figure 2). Within that document, the attributes and location of subsurface explorations, of which there may be just one or many, and which may range from shallow test pits to deep water wells, are stored at the second level (EXPLORATION table). For each exploration point, all the related subsurface layers described in each exploration log are stored at the third level. Any additional layer-based information, either comments made on the original logs or subsequent geologic interpretations of the individual layers themselves, are stored at this level as well. The structure of the database and the fields were designed to accommodate geologic data from a variety of sources and formats, to create a common interface for entering and displaying data, and to support current and future scientific and engineering studies.
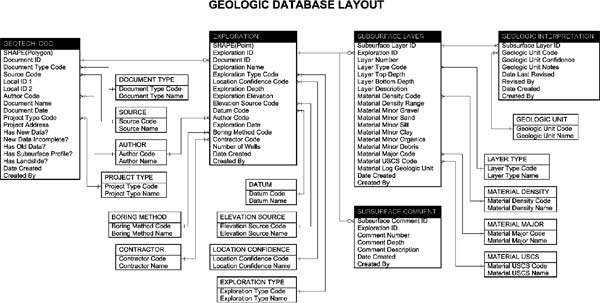
Figure 2. Three-level database structure, showing the data fields and their relationships for the spatial data (GEOTECH_DOC and EXPLORATION) and the nonspatial data (SUBSURFACE LAYER, SUBSURFACE COMMENT, and GEOLOGIC INTERPRETATION).
Data are entered through customized GIS and database interfaces. Spatial data, namely the area covered by a document and the data points representing the explorations, are entered through a GIS interface along with their associated attributes; the nonspatial data (i.e. the subsurface geologic layer data associated with a specific exploration data point, together with any comment or interpretation) are entered through customized database forms.
Guidelines have been developed to ensure that the data are entered in a uniform and consistent manner. These guidelines provide normalization of data collected from boring logs, test pits, and other exploration types that were prepared by many different consultants and agencies under a variety of classification systems and protocols. Geologic layer-entry guidelines were developed to facilitate translation from the logs to the database. Similar guidelines exist for document and exploration point entry. The guidelines define the fields, give default values, and describe what to do if data are missing from the log.
The database contains raw data, in particular the verbatim transcription of the original on-site geologists or well-drillers description of each layer. This information is then parsed manually into fields for density, major and minor materials, and the presence of organics and debris in order to facilitate future database queries. Fields are also available for geologic interpretation, the metadata on original source documents, and anticipated accuracy of point locations.
Since 1998, we have populated the main database tables with a significant amount of data:
| Geotechnical Documents | 14,251 |
| Exploration Points | 70,355 |
| Subsurface Layers | 291,101 |
Because there are no fixed limits on the prospective area of database coverage, we cannot estimate an ultimate magnitude of data acquisition. Mainly by increasing the geographic area, 1300-2800 documents per year have been added to the database. Within the city of Seattle, where we have been working steadily since the projects inception, we have an ongoing program to add new data as it is received by the City; nearly 200 new documents were added from there in 2005. The geographic areas covered by subsurface information are illustrated in Figure 3.
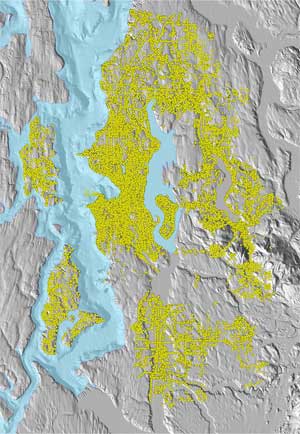
Figure 3. Database coverage currently available, as indicated by the distribution of exploration points (light-colored circles)
When we began the project, data were entered into the database through customized ArcView and Microsoft Access interfaces to take advantage of readily available software and to simplify interactions between multiple (mainly municipal) users, nearly all of whom had access to these software tools but not to anything more sophisticated. The spatial data (document areas and exploration data points) were entered through an ArcView interface along with their associated attributes. Once the spatial data were recorded, nonspatial data (layer data and associated comments) were entered through customized Microsoft Access forms. The two phases of the data-entry process corresponded to the two main components of the database: the spatial data, stored in ArcView shapefile format, and the nonspatial data, stored in a Microsoft Access file. This approach was chosen to take advantage of the relational database capabilities of Microsoft Access while keeping the spatial data in a common format.
Increasing volumes of data, the desire to accommodate multiple simultaneous users, and concerns for fail-safe back-up led us to our present system, whereby the database and corresponding GIS are stored in ESRIs geodatabase format employing ArcSDE with an Oracle database backend. ArcSDE was chosen for its ability to accommodate a multiuser editing environment for spatial data using multiversioning, and for its ability to efficiently store and deliver geospatial datasets. Access to the data stored in the geodatabase is available through a number of application program interfaces (APIs) so that customized applications and services can be developed on a variety of computer platforms. Full access to the data is also available to native Oracle objects such as views, functions, and stored procedures, making it possible to programmatically query and analyze the data efficiently. The previous customized tools for entering, analyzing, and viewing data were converted for use within ArcMap by using Visual Basic and object model component technology. Our municipal partners, however, have generally required conversion of data to ESRI shapefile and dBASE dbf file formats to maintain compatibility with their ArcView systems. The database and corresponding GIS are currently stored on a Linux server and are accessed by several Windows workstations through a gigabit network.
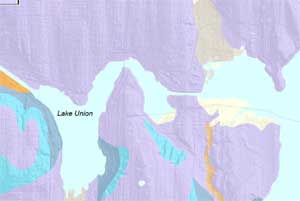
One of the primary direct applications of the subsurface geologic database has been to support the preparation of new geologic maps. To date, the area where we first began our compilation (the City of Seattle) has been completely remapped at 1:12,000 scale; a preliminary compilation is available (Troost, and others, 2005a), with its four constituent quadrangles in various stages of USGS technical review and publication (Booth and others, 2005; Troost and others, in review a, b; Booth and others, in review a). These maps represent a dramatic increase in both the detail and quality of geologic information for the city relative to the only previously available map (Waldron and others,1962, scale 1:31,680; see Figure 4).
 |
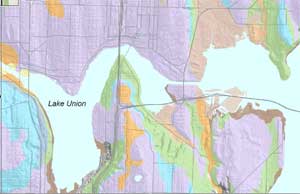 |
Figure 4. Comparison of old and new geologic maps of Seattle (differences only evident in online color version; printed version available only in grayscale). A portion of the geologic map of Seattle from Waldron and others (1962; top), and from Troost and others (2005a; bottom). |
|
In areas where both local-agency concerns and regional geologic questions have warranted intensive study, and where funding was provided, this database has been applied to the development of new geologic maps. These include the westward and eastward extension of the Seattle fault (Haugerud, 2005; Booth and others, in review b; Troost and others, in prep.) and planned expansion areas of the regional wastewater-treatment system, particularly just north and east of Seattle.
In addition to the focused acquisition of data and development of very large-scale geologic maps, we are developing a chronological and lithologic context for the complex sequence of glacial and nonglacial deposits in the central Puget Lowland, one that can be used to evaluate the distribution, correlation, and deformation of individual geologic units across the region. As a result of the mapping and stratigraphic and chronologic work being done for our geologic maps, we have established a regional stratigraphic nomenclature and updated timescale. Fundamental errors of stratigraphic (mis-) assignment in the southern Puget Lowland have been recognized over the last two decades, reflecting profound differences between stratigraphic sections exposed in the southeastern (Crandell, 1963) and northern Puget Lowland (e.g., Easterbrook and others, 1981; Blunt and others, 1987). Regional mapping and chronologic efforts (e.g., Hagstrum and others, 2002; Mahan and others, 2003; Figure 5) are now beginning to reconciling these differences (see also Booth and others, 2004). Through collaboration with USGS scientists, for example, we have shown that the stratigraphic units identified at type sections on Whidbey Island (Easterbrook, 1986), 40 km north of Seattle, can be identified more than 70 km south in the Tacoma area using absolute age control (Troost and others, in press), and we have identified deposits from mid-Pleistocene climatic stages previously undocumented anywhere in the Puget Lowland.
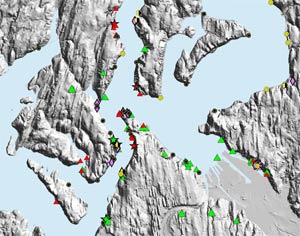
Figure 5. Map of analytic samples of Quaternary sediments collected, dated, and/or compiled by the project. Key: circles = paleomagnetic samples; diamonds = IRSL age samples; triangles and stars = 14C age samples; snowflake = fission-track age sample.
The manner of data distribution outside of our immediate research group has been guided by the individual users. For those public agencies that have provided us with sources of data and, commonly, funding as well, we have been delivering quarterly (static) updates of the database, generally as ESRI shapefiles of the documents and exploration points and dBASE dbf files for subsurface layers and comments. The agencies, in turn, load these data onto their intranets, to be available to staff (Figure 6). Actual use of the data, however, is almost certainly quite variable. In the City of Seattle, for example, where our interaction and funding spans seven years, engineering and building departments use the database regularly and we maintain a systematic program of adding new information and delivering it to the City. For some of the smaller cities, however, usage by staff is probably less common; in addition, many of these smaller jurisdictions were only contacted by us during a single interval of data collection, and so the one-time digital compilation of geologic explorations will drift inexorably more and more out-of-date. We have not yet solved the logistical and financial problem of maintaining a truly current data set in each of the areas once visited for data acquisition.
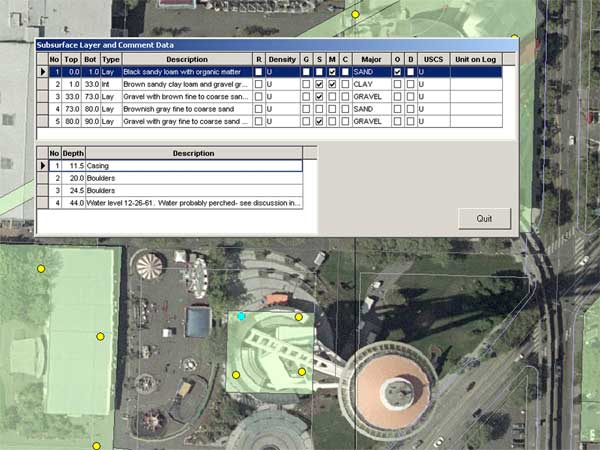
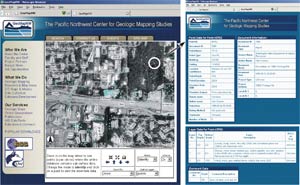
Figure 6. Example of an ArcView data query screen. The base aerial photograph is of the Space Needle; document areas are shaded (green in color online version). Of the four explorations originally drilled for the Space Needle foundation, that in the upper left-hand corner of the Needle footprint (turquoise highlight in online version) has been selected; the pop-up window shows the description of the five geologic layers in the exploration log and the dominant and secondary grain sizes as parsed from the layer description (upper table), and any comments (lower table).
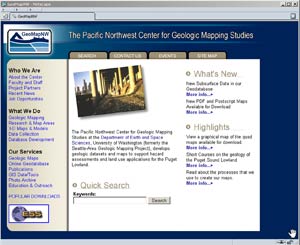
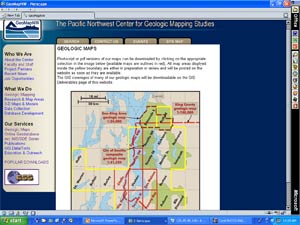
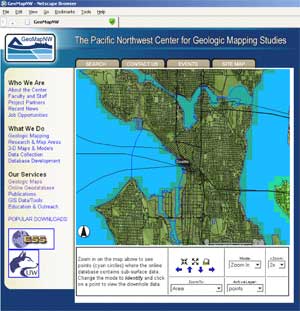
We also provide a point of public access to our data, in part to satisfy our funders goal of public data access, and in part to provide a broader service to the geotechnical and engineering community without making undue demands on our time. Access is through the Center website, http://geomapnw.ess.washington.edu (Figure 7a); the most heavily used links are those for downloading of publications and geologic maps (Figure 7b) and for individual queries of the geologic database (Figure 7c and d), for which we upload a static update on a roughly quarterly basis. Typical rates of access for the first half of 2005 have been about 700 unique visits per week, with 75 downloads/week of reports and maps and about 300 queries/week of individual exploration logs. At the continuing request of colleagues in the consulting community, we are in the process of scanning all of our borehole data and posting those scanned images on the web as pdf files. Currently almost two-thirds of our files are scanned and available.
 |
 |
| A | B |
 |
 |
| C | D |
Figure 7. Screenshots of the types of data access available from our website. (A), Center home page (http://geomapnw.ess.washington.edu), view of index screen for downloading geologic maps. Queries for those maps available only in draft form are served in .pdf format from this site directly; queries for those maps that are already published by the USGS are redirected to the corresponding USGS page. (C) view of part of central Seattle in the ArcIMS window used to view and select explorations in map view. Zooming in to a local area (D) allows selection of an individual point (highlighted in white circle), which opens windows for the points layer information and for the metadata on the data point and the source document. |
|
We have actively participated in and led seminars, field trips, professional short courses, and workshops, to educate the scientific and nontechnical community about the baseline geologic setting of the Seattle and Tacoma areas. This acknowledges a critical emphasis in urban-area geology, namely bridging the gap between research and consulting geology. This is an ongoing effort with steadily increasing attention and influence. It also requires a significant expenditure of time, but one that we feel is critical to the long-term viability and value of our work.
To further support this outreach, a technical advisory group was established early in our first year to enhance communication between this project and the end users of the products, especially consultants and agency representatives. The groups membership, several dozen in number, emphasizes senior members of the regions geologic, geotechnical, hydrogeologic, and engineering consulting firms, and also includes representatives from state, city, and local agencies who are both the major users and the major contributors of data.
Our partnerships have permitted the digital archiving of some of the very best dataclosely spaced, deep, linear transects of continuously sampled boringsprovided by large capital projects. Together with new field mapping and the many additional sites of prior study by both public agencies and private individuals, these data are now starting to provide excellent opportunities to learn about the regions geology. They are also forming the basis for the new, detailed, large-scale geologic maps of the regions urban and urbanizing areas that are now being prepared and published.
FUTURE PLANS AND ISSUESAlthough the project in its current form has demonstrated the value of detailed data compilation within the framework of regional scientific investigations, the full range of this approach to geospatial data has been explored only modestly. We recognize several additional areas in which this work could expand to the greater benefit of current and future users:
Although these future plans would expand the value of detailed geologic information, the current costs of the present effort are already quite substantial: for example, a detailed, digital, USGS-published 7.5 geologic quadrangle map based on new field work and a subsurface database has averaged $250,000 at 1:24,000-scale and about twice that amount at 1:12,000 scale (i.e. across the City of Seattle). Derivative maps are not nearly as expensive, but they too add an incremental expense. In an urban area such as Seattle, the cost of detailed geologic mapping and a subsurface database is more palatable when expressed as a function of population density, with rates of about $1.75 to $2.00 per person (Troost and others, 2005b). Ultimately, however, the value of detailed mapping and geologic data must be quantified wherever we try to initiate or continue support for them. The question we therefore face is whether these new geologic products are worth their cost; and even if they are, can we find funding agencies with the foresight to recognize that value and to bear the expense?
Blunt, D.J., Easterbrook, D.J., and Rutter, N.W., 1987, Chronology of Pleistocene sediments in the Puget Lowland, Washington, in Schuster, J.E., editor, Selected papers on the geology of Washington: Washington Division of Geology and Earth Resources Bulletin 77, p. 321-353.
Booth, D.B., Troost, K.G., and Shimel, S.A., in review a, Geologic map of the Seattle NE quadrangle: U.S. Geological Survey Scientific Investigation Map, scale 1:12,000.
Booth, D.B., Troost, K.G., and Walsh, T.J., in review b, Geologic map of the Issaquah quadrangle: U.S. Geological Survey Scientific Investigation Map, scale 1:24,000.
Booth, D.B., Troost, K.G., and Shimel, S.A., 2005, Geologic map of northwestern Seattle (part of the Seattle North 7.5 x 15 quadrangle), King County, Washington: U.S. Geological Survey Scientific Investigations Map 2903, scale 1:12,000, available at http://pubs.usgs.gov/sim/2005/2903/.
Booth, D.B., Troost, K.G., Clague, J.J., and Waitt, R.B., 2004, The Cordilleran ice sheet: Chapter 2, in Gillespie, A., Porter, S.C., and Atwater, B., eds., The Quaternary Period in the United States: International Union for Quaternary Research, Elsevier Press, p. 17-43.
Crandell, D.R., 1963, Surficial geology and geomorphology of the Lake Tapps quadrangle, Washington: U.S. Geological Survey Professional Paper 388-A, 84 p., 2 plates.
Easterbrook, D.J., 1986, Stratigraphy and chronology of Quaternary deposits of the Puget Lowland and Olympic Mountains of Washington and the Cascade mountains of Washington and Oregon: Quaternary Science Reviews, v. 5, p. 145-159.
Easterbrook, D.J., Briggs, N.D., Westgate, J.A., and Gorton, M.P., 1981, Age of the Salmon Springs glaciation in Washington: Geology, v. 9, no. 2, p. 87-93.
Hagstrum, J.T., Booth, D.B., Troost, K.G., and Blakely, R.J., 2002, Magnetostratigraphy, paleomagnetic correlation, and deformation of Pleistocene deposits in the south-central Puget Lowland, Washington: Journal of Geophysical ResearchSolid Earth 107 (B4): art. no. 2079, Apr. 10, 2002.
Haugerud, R., 2005, Preliminary geologic map of Bainbridge Island, Washington: U.S. Geological Survey Open-File Report 2005-1387, scale 1:24,000, available at http://pubs.usgs.gov/of/2005/1387/.
Mahan, S.A., Troost, K.G., and Booth, D.B., 2003, Dating sediments older than 100 ka in the Seattle-Tacoma urban corridor: A test for infrared stimulated luminescence and thermoluminescence on fine grain deposits: Geological Society of America, Abstracts with Programs, Annual Meeting, v. 35.
Troost, K.G., Booth, D.B., and Wells, R.E., in press, Geologic map of the Gig Harbor 7.5-minute quadrangle, Washington: U.S. Geological Survey Scientific Investigation Map, scale 1:24,000.
Troost, K.G., Booth, D.B., and Wisher, A.P., in preparation, Geologic map of the Mercer Island quadrangle: U.S. Geological Survey Scientific Investigation Map, scale 1:24,000.
Troost, K.G., Booth, D.B., Shimel, S.A., Blakely, R.J., and Wells, R.E., in review a, Geologic map of the Seattle SW quadrangle: U.S. Geological Survey Scientific Investigation Map, scale 1:12,000.
Troost, K.G., Booth, D.B., and Shimel, S.A., in review b, Geologic map of the Seattle SE quadrangle: U.S. Geological Survey Scientific Investigation Map, scale 1:12,000.
Troost, K.G., Booth, D.B., Wisher, A.P., and Shimel, S.A., 2005a, The geologic map of Seattlea progress report: U.S. Geological Survey Open-File Report 2005-1252, scale 1:24,000, available at http://pubs.usgs.gov/of/2005/1252/.
Troost, K.G., Booth, D.B., Shimel, S.A., Wisher, A.P., and ONeal, M., 2005b, Detailed geologic mappingis it worth the cost? Applications of a geodatabase of the Seattle, Washington area: Geological Society of America, Abstracts with Programs, Annual Meeting, v. 37.
Waldron, H.H., Liesch, B.A., Mullineaux, D.R., and Crandell, D.R., 1962, Preliminary geologic map of Seattle and vicinity, Washington: U.S. Geological Survey Miscellaneous Investigations Map I-354, scale 1:31,680.

![]() U.S. Department of the Interior |
U.S. Geological Survey
U.S. Department of the Interior |
U.S. Geological Survey
URL: pubsdata.usgs.gov /pubs/of/2005/1428/booth/index.html
Page Contact Information: David R. Soller
Page Last Modified: Saturday, 12-Jan-2013 22:05:39 EST
