U.S. Geological Survey Open-File Report 2005-1428
Digital Mapping Techniques '05—Workshop Proceedings
Dynamic Digital Maps (DDMs) are computer programs that provide a way to distribute and maximize the use of map products in an easily accessible digital format. High quality color maps, digital images, movies, analytical data, and explanatory text, including collar text and field guides, can be integrated in this cross-platform web enabled format that is intuitive to use, easily and quickly searchable, and requires no additional proprietary software to operate. Maps and photos (saved as jpeg files) and movies are stored outside the program, which acts as an organizational framework and index to present these data. Analytical data are uploaded and stored as tab-delimited text within the program, and can be saved as text documents, for use out of the program, or for inclusion in traditional databases. An open source program, the "DDM-Template" into which you can insert your data, and an accompanying "Cookbook" on how to do this are available at http://ddm.geo.umass.edu/, along with numerous DDMs that demonstrate this potential. Making a DDM from the Template requires the use of the multi-platform programming environment Revolution (www.runrev.com), which has a low learning curve. Once your data have been added to the "DDM-Template" and stored in specified directories, a single short step allows you to create stand-alone programs for numerous Unix, and all Windows and Macintosh, operating systems. The correct stand-alone DDM program for a given user's operating system can be made available for download from http sites. The DDM program can then access its associated data directly from that site with no browser needed. Alternatively, the entire package can be distributed and used from CD, DVD, or from flash-memory storage. The Office of the Massachusetts State Geologist is experimenting with the production of the Marlborough Quadrangle as a Dynamic Digital Map (http://ddm.geo.umass.edu/ddm-marl).
With the advent of the digital age, and the public's demand and dependence on it as a primary source of information, geologic map publishers face the difficult problem of how most effectively to distribute their products in this new medium. The problem centers around how best to integrate the associated text, analytical data, and media (images and movies) demanded by the public, into an easily usable map-based package that can be distributed via both the web and CD/DVD. Ideally, this product must be compatible with a variety of computer operating systems, not be dependent on browsers, and should not require the user to own any specialized software to use. With its inception an outgrowth of the U.S. Geological Survey's map modernization program, the Dynamic Digital Map of the Springerville Volcanic Field (below, "DDM-SVF"), published by the Geological Society of America on CD (Condit, 1995a, 1995b, 1999, and Condit and others, 1999) was a first step toward answering this challenge. Subsequent funding by the National Science Foundation resulted in the creation of a DDM Template that others can use to make their own DDMs. This Template is a cross-platform open-source computer program into which map authors, editors, or compilers insert their own map data using the Revolution programming environment. The map data to be inserted includes file names, which are used by the program to link external data files (for example, maps and images in jpeg format, QuickTime movies, animated gifs, etc.), and text files (for example, map collar text, field trip guides, geologic settings) and any analytical data, such as geochemistry. When modifications to the Template are complete, the map creator instructs Revolution to, in a single step, make numerous stand-alone programs (DDMs) for different operating systems. These DDMs can then be compressed and saved as zip or dmg (disk image) files, and made available for download from a web page (Figure 1). This manner of distribution requires the user to be linked to a fast web connection, so that associated files can be displayed by the program as it asks for them from the DDM's http address. Alternatively, the DDMs can be distributed on CD, DVD, or flash-memory drives.
In this paper I describe DDMs and introduce you to how you can make them. DDMs are not, it should be understood, a substitute for the analytical capabilities of data base programs, or for GIS such as ArcGIS, which are superb tools in their own right. Instead, DDMs provide a tool for anyone who wishes to publish color maps, images, movies, animations and analytical data in a universal format requiring no proprietary software to use. They integrate the digital publication of high quality color maps and associated media in a way that can reach an audience ranging from the research specialist to the interested layman.
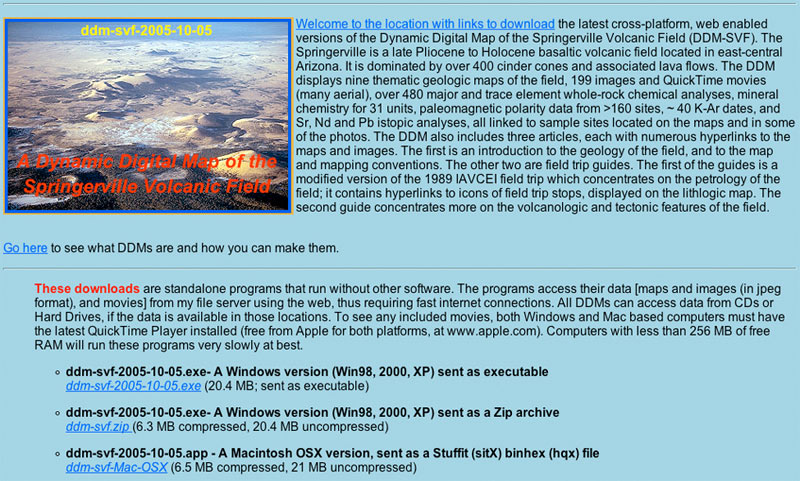
Figure 1. A typical web page of a Dynamic Digital Map (of the Springerville Volcanic Field, in this case, and referred in some other figures as "DDM-SVF"). From this page the viewer can download the DDM that is compatible with their operating system. Click on thumbnail to view full-size image.
The start-up page of the DDM (Figure 2) gives the user the option to access associated media (the DDM's maps, image, and movies) using "Local Access" data sources (for example, CD, DVD, or a hard drive) or remote "WEB Access" sources. The link to "Program Status Notes" opens a page with text that may be aimed at the programmer, or may be aimed at the user, giving plans for on-going improvements or additions to the DDM program. After the user chooses the data source (web or local disk), the program opens the DDM's "Home Screen".
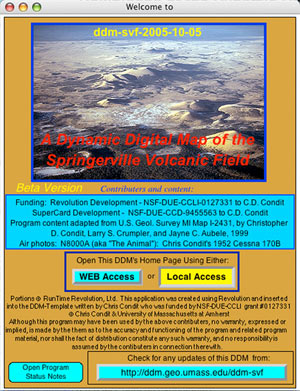
Figure 2. Start-up page of the Dynamic Digital Map of the Springerville Volcanic Field. In addition to giving the user a choice of accessing the program's data from local or remote sources via the "Local Access" and "WEB Access" buttons, the page displays acknowledgements and gives access to the web page where program updates are stored, and to notes describing recent changes made to the program.
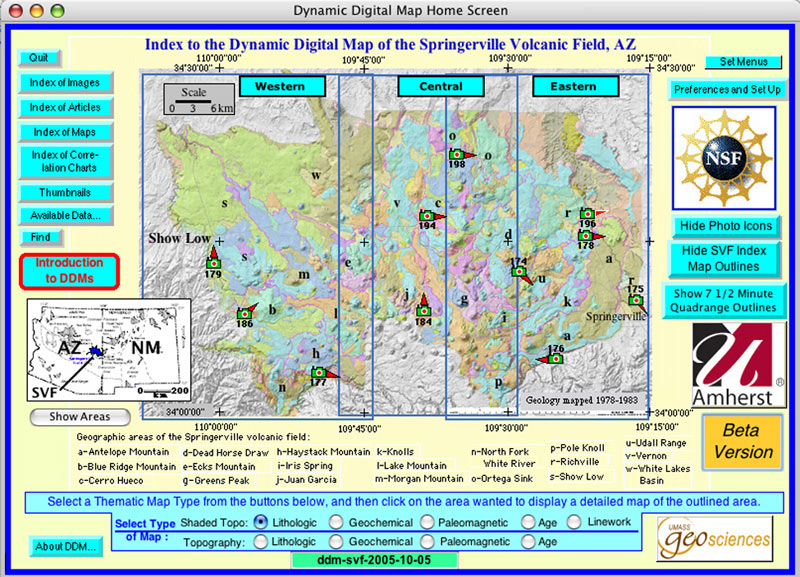
The "Home Screen" page features an index map that provides links to open detailed maps (Figure 3) from graphic illustrations outlining the areas of these map segments. Because the maps that a DDM displays are jpeg images, and the size limit for these raster files is 4000 x 4000 pixels, any map larger than those dimensions must be divided into smaller segments. For maps that have the option to display each of these areas as different thematic types (for example, a topographic map and an orthophoto map), selection buttons across the bottom of the screen give that choice. On the left, beneath the "Quit" button, a series of buttons open indexes that contain lists of the DDM's content. These index categories include (Figure 4) images (photos and movies), articles (for example, map collar text, guide articles), maps, correlation charts, cross sections (not shown for this map), and available analytical data.
Index lists contain hyperlinked text lines, each linking to the data described. These lists can be sorted by index number (leftmost column), or by various column headings (Figure 4). Lists can likewise be searched by keywords found in the comment field.
 |
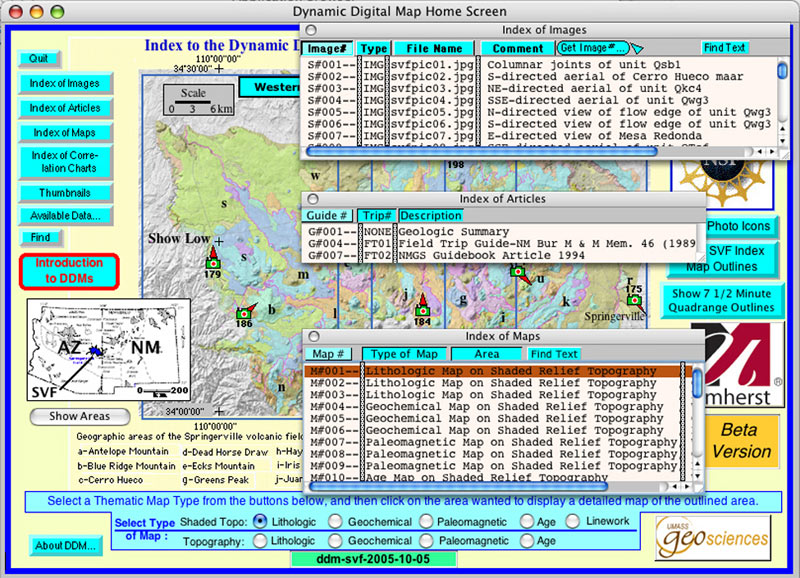 |
Figure 3. Home Screen of the Dynamic Digital Map. Access to all components of the DDM (maps, images, articles, correlation charts, and analytical data) can be opened from buttons on this page. Across the bottom, radio buttons allow the selection of thematic map type. |
Figure 4. Examples of three types of index lists in the DDM-SVF. All lists can be sorted by column, by clicking on the column headings. For example, in the Index of Images, column sorts include (from left to right) by "Image Number", by "Type" (Image, QuickTime movie, QT panoramic movie), by "File Name", and alpha-numerically by first word in the "Comment" or key words column. |
All DDMs have menu selections across the top of the screen, most of which, in the "Controls-Access" menu list (Figure 5), mimic the functions of the buttons found on the "Home Screen". One notable addition is the first menu selection, which allows the user to close all windows and return to the "Home Screen". The first two "Map" menu items ("Map Explanation" and "Map Features Access") open palettes explaining map unit symbols and colors for a given thematic map, and provide access to features associated with the open map segment (top center and left, respectively, of Figure 6). In the top right portion of the map view window (Figure 6), a map explanation for symbols common to all thematic maps is displayed.
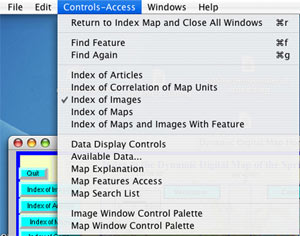
Figure 5. An example of some of the Menu Selections available in the DDM-SVF. The first four "Index" menus provide linked "Tables of Contents" for the DDM. The "Index of Maps and Images With Feature" menu selection will dynamically search for and compile a list of all maps and images (including the image's captions) that contain the asked-for words. Not shown is a "File-Save Data" menu selection used to save analytical data to tab-delimited text files. Over 480 samples of whole-rock major and trace-element data are included in this DDM, along with mineral chemistry for 31 units, magneto-polarity for 160 sites, K-Ar data for 40 sites, and Sr, Nd, and Pb isotopic data for 35, 22, and 20 sites, respectively.
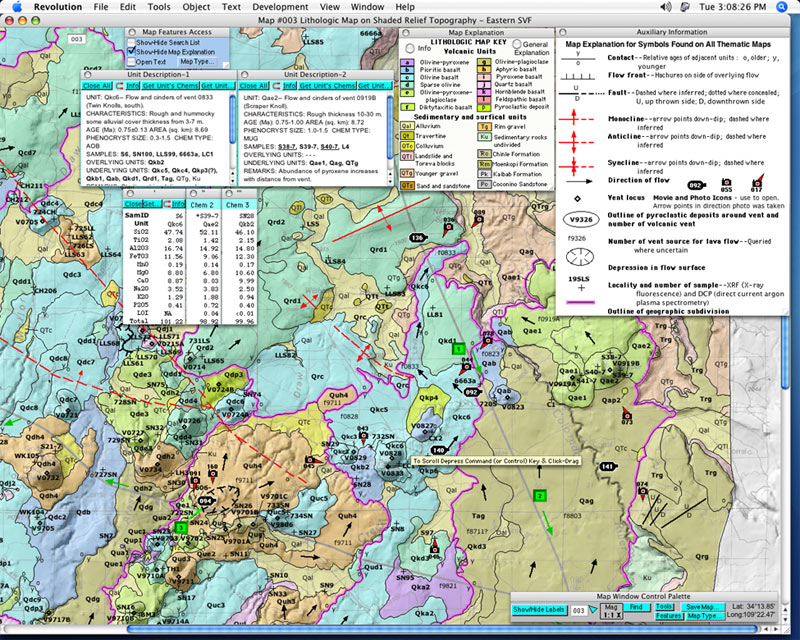
All map unit symbols and sample site labels can be selected with a mouse click to open a new window or palette showing information pertaining to that label (the label is stored in the program as a named text vector object, see below). On Figure 6, a lithologic thematic map of the eastern part of the Springerville field, two labels for lava flow units Qkc6 (near the lower center of the map) and Qae2 (near the center right of the map) have been clicked on, to display floating palettes containing unit descriptions (top left of Figure). Sample site labels near these units have also been clicked to display the major-element chemistry associated with each site. Additional sample data can be displayed by clicking on the sample ID found in the Unit's Description palette, or by clicking one of the buttons across the top of that palette (as can additional Unit Description palettes, with similar clicks on map unit symbols).
Figure 7 shows the same area as Figure 6, but instead displays a different thematic map, the paleomagnetic polarity of the lava flows. Sample sites associated with paleomagnetic data replace those associated primarily with chemical and petrologic information on this map, and several sites have been clicked on to display their associated data. In the lower right side of the maps in Figures 6 and 7, note the latitude and longitude read-out in the "Map Window Control Palette", which gives the cursor location. Measurements for straight and curved line distances and areas, along with the cursor location, can be made using the "Tools" button and its associated palette (left side of Figure 7). The "Measurement Collection Palette" (upper right) records the data for map measurements, and can be saved as a text file. The drawings of these measurements (M#1 just above the palette showing magnetic polarity data, and M#2 just below the left side of the "Measurement Collection Palette") can also be saved as an image, along with the underlying map, using the "Save Map" button on the right side of the "Map Window Control Palette".
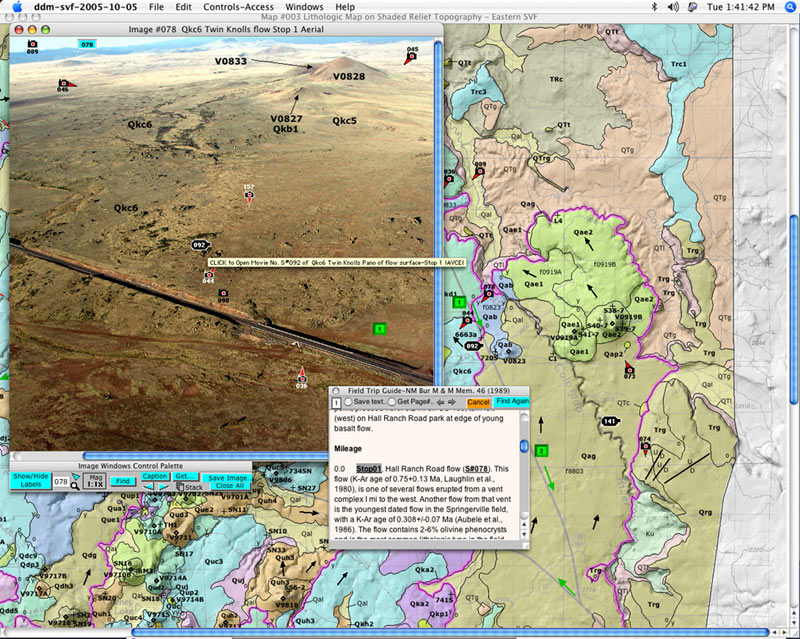
Camera icons are placed at the location of photos, and the arrows denote the direction the camera was aimed. When the user holds the cursor over a camera icon (see the camera icon "078", Figure 7, right center, just above the rollover text "Click to open . . .), the key words describing that image, found in the "comments" column of the "Index of Images" palette are shown as a "Tool Tip" in the rollover. Movie icons (see southwest of icon "078") likewise display key words, as do field trip stop icons (the green rectangle numbered "1" slightly closer to the image icon "078").
A click on field trip icon "1", (Figure 7, right center) opens a floating palette containing an associated article, in this case a Field Trip Guide (Figure 8). The program centers the text at the point in the guide that describes that stop. A click on the hyperlinked text in the guide (in bold font and underlined, S#078) opens the associated digital photo. An "alt-click" on that same text would scroll the map and center it on the camera icon, alternatively, an "alt-click" on the line containing the image number in the "Index of Images" palette does the same. Likewise, a click on the turquoise image number in the upper left side of an open image finds the camera icon on the map. Additional clicks on other camera icons on the map or other images will open up to nine images; a click on the movie icon "092" in image "078" will open a QuickTime panorama of the lava flow top. Any one of these images or movies may have a Figure caption associated with it, displayed by selecting the "Caption" button on the "Image Windows Control Palette" (bottom, Figure 8).
The text for each article or image/movie caption may be displayed at one of three levels of sophistication (or in one of three languages), if the DDM complier chooses to include this capability. In this way a single DDM can reach audiences ranging from the research scientist to the interested layman or student, thus maximizing its outreach potential. Changes to the "User Level" settings can be made in the "Preferences and Set Up" palette (not shown), along with changes to various other settings (for example, thematic map type, "Tool Tip" displays, desk top visibility, and which ancillary palettes to automatically open when a map segment is displayed).
DDMs have built into them the capability to search all the analytical data sets included in them for a sample's (or site's) data or to determine if a geologic unit has been analyzed for a given data type (for example, is there any trace element data for unit Qab?). The search will either highlight the found sample in a list of each type of data, or both highlight and display the data (Figure 9). Selecting the "Controls-Access / Available Data . . ." menu (or the "Available Data " button on the "Home Screen") opens a dialog (Figure 9) that gives the user a choice of search options; a subsequent dialog box provides the user a place to enter the sample, site, or unit for which information is needed. The result (top right, Figure 9) is a series of lists of all samples for each type of analytical data. In this case I've asked the program to search for sample 717MR. In 7 of the 11 lists, sample 717MR was found, and is highlighted in the second ("Chem") and third ("Traces") lists but not in the fourth ("Min Chem") list, etc. In lists containing the selected sample the background color of the title for that data type changed to green. In those lists where sample 717MR is not found, the background title for that data type is colored orange. If that sample is found, it is highlighted in the list; clicking on the sample's entry displays the data, whereas an alt-click locates the sample on the map.
Searches for the location of objects on maps and images (for example, samples or map units), initiated from sample lists as described above, or by using the menu selection "Control-Access / Find Feature" recenters the map on the found feature. A red box surrounds the feature and flashes several times. When the feature is not found on the open map, the user is asked if they want to look for it on other maps or images. If so, the DDM searches all maps, images and image captions, and presents the user with a palette (Figure 9, lower right) containing two click lists. The upper list displays all maps with that sample, the lower list all images (and image captions) containing that sample. A click on the list opens the map or image in the line clicked on, and as above, finds the object.
 |
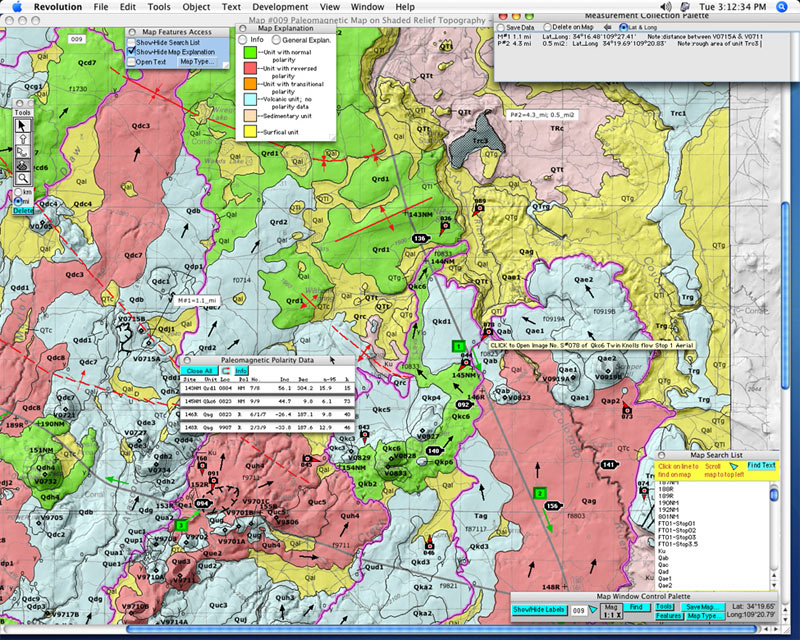 |
Figure 6. The easternmost of three map segments of the DDM-SVF, displaying one of nine thematic types; here, the map units reflect the lithologic variations (see map key in upper center) of the lava flows. Compiled on a 1:100K topographic map base, the geologic map is draped over shaded relief. Several of the bold symbols on the map have been selected by mouse-click, causing the data associated with them to be displayed (here, we see map unit descriptions and lava flow chemistry). Map scrolling is via scroll bars or by using a click-drag with the control (or command) key depressed (see the popup "Tool Tip", near bottom-center of map). |
Figure 7. A paleomagnetic thematic map of the same area shown in Figure 6. The sample site symbols selected by a mouse-click display the data associated with this new thematic map type, and the units are colored to highlight the magnetic polarity of the lava flows. Note the latitude-longitude read-out of the cursor location, and the "Map Search List" palette (lower right). |
 |
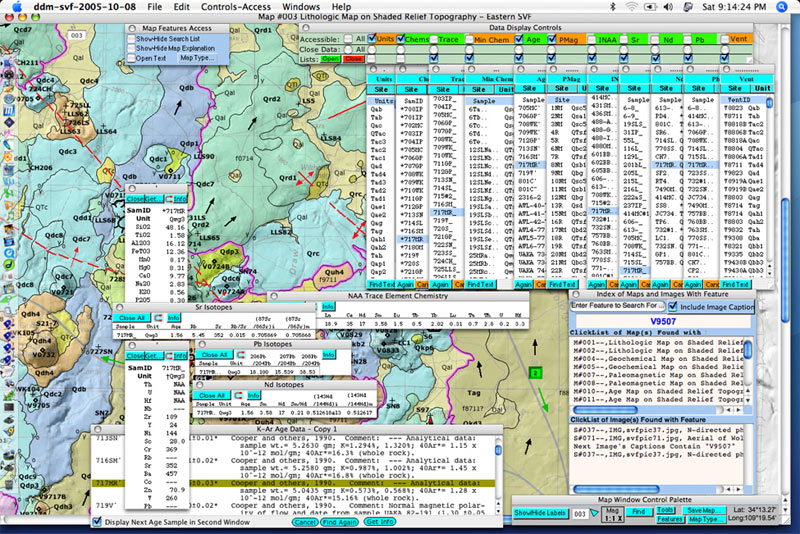 |
Figure 8. Example of the hyperlink-accessed image and Field Guide. This image is opened by clicking on camera icon "078" of the lithologic map. When the icon on a map that denotes a field trip location or "stop" (for example, the green 4 on this map) is selected with a mouse-click, the description of the field trip stop, as reported in the guidebook article, is displayed. The image window takes its title from the key words associated with the image number in the "Index of Images" palette. Key words also are displayed in the "Tool Tip" for movie image "092", as shown in the center of the figure. |
Figure 9. Screen showing the result of searching for analytical data using the DDM-SVF. Here, the "Available Data" search shows any occurrences of a sample in all data sets, and displays that data. In the lower right part of the map window, a palette displays the result of searching for a feature (a volcanic vent, number V9507) that was not found on the displayed map. All maps, images, and captions are searched for the occurrence of the feature, and a list of where it was found (maps, top part of palette; images, bottom part of palette) is presented to the user. A click on a record will display that map or image. |
A Dynamic Digital Map is composed of two major components. The first is an open source computer program (the DDM-Template), written in a programming environment called Revolution. The second is a system of file structures into which various components that make up the individual DDM are placed. These include maps and photos (jpeg file format), and movies (QuickTime format). The DDM-Cookbook (Condit and Albrecht, 2005) contains detailed step-by-step descriptions, complete with screenshots, of how to make a DDM (http://ddm.geo.umass.edu/Cookbook2005-08-12.pdf).
The DDM-Template program is essentially a shell into which the mapmaker inserts their data (for example, map collar text, text for field trip guides, associated analytical data) and metadata about external files the program must access when a user asks for them to be displayed.
The programming environment, Revolution, was chosen because it is a graphical, high-level, object oriented "language" that executes quickly, has a low learning curve, and is multi-platform. The graphic orientation is important, since mapmakers or compilers must visualize the map layout and produce a graphic product. The Revolution programming environment (Figure 10) organizes its data into packages known as "stacks" that loosely correspond to windows, with each stack containing one or more cards, on which objects can be displayed. These objects may be text, buttons, images, or vector graphics to name a few; each stack can display only one card at a time. Revolution is conceptually very similar to the Macintosh HyperCard programming environment, but was originally written (as MetaCard in 1990) for use on various UNIX-based operating systems, and later ported to the Windows and the Macintosh OS. The MetaCard engine technology was in 2003 acquired by Runtime Revolution, who had built a sophisticated user interface with expanded capabilities, based on that engine. (For details see http://www.metacard.com/.)
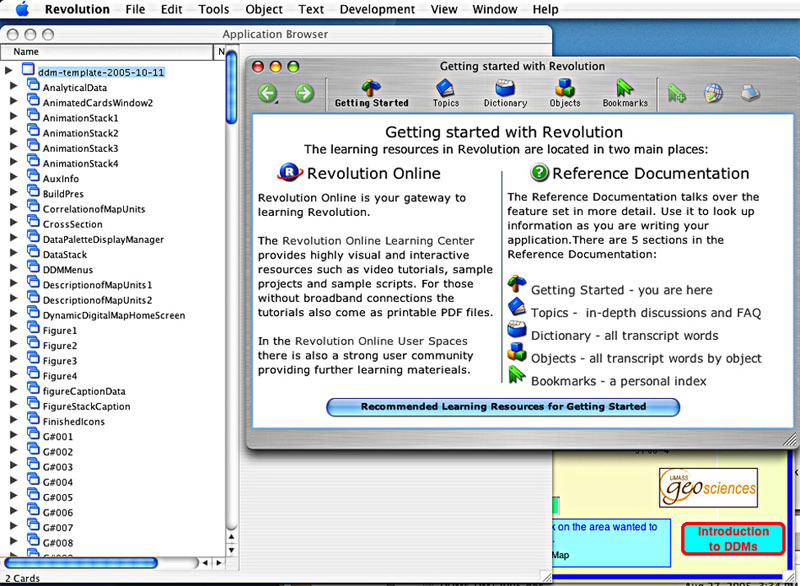
Figure 10. Example of the Revolution programming interface. The left side lists the "stacks" included in the DDM-Template shell (see text for details). On the right is an example of the documentation and programming help available. Click on thumbnail to view full-size image.
Revolution is a high-level language, meaning most of the command-line programming steps that create objects such as windows or buttons are hidden from the user, and these objects can be simply called and fit together to make the map. The objects, once created, can be duplicated (or "cloned"), and these duplicates retain all the characteristics of their "parent" object, thereby making programming more efficient. Revolution executes very quickly because it compiles the code (or scripting) associated with any object.
Revolution has a low learning curve; the essentials for creating DDMs from the DDM-Template can be learned in a day or two. The company's site (http://www.runrev.com) has web access to about a dozen excellent, free, 8-to-10 minute videos, of which 6 are directly applicable to making DDMs. The scripting is in a format familiar to those who use the English language. Built into the Revolution programming interface is an excellent suite of "Help" items, including Introduction to Revolution, Quick Reference guides, a Dictionary, and Frequently Asked Questions. The online exercise, "Getting Started with Revolution" takes a few hours and introduces you to using Revolution. I have co-authored a "DDM-Cookbook" which assumes you have taken the time to view the videos, and have worked through the online tutorial exercise. My tutorial, which takes an additional few hours, is entitled "A Quick Start to Making DDMs." It gives step-by-step instructions in how to make a DDM from images and maps already prepared. The DDM-Template that the mapmaker uses to create their own DDM was designed to minimize the need for the mapmaker to do any programming. The mapmaker's job instead is to substitute into the Template their own data and metadata to complete their own DDM.
Revolution is a multi-platform programming environment, which means one can make DDMs on Windows, Macintosh, and Linux (and other Unix) platforms. Many of my students at UMass work in my lab on Macintoshes, copy their work to USB flash-memory drives, transfer it to their Windows machines and work on it at home. They then bring their work back to the classroom, transfer it to their Mac, and continue their work. I have accommodated differences between Windows and Macintosh systems almost completely in the Template; most irksome are occasional font compatibility issues. For this reason, I recommend checking the DDM on various platforms.
Once a DDM-maker has completed their DDM in the programming environment, they can turn it into a "stand-alone" program that requires no other program to run. Because the old Macintosh OS 9 has file characteristics that cannot be created in the Windows environment, to make a Macintosh OS 9 file at the same time you make a Windows stand-alone DDM, you must be working on a Macintosh computer. You can make both a Macintosh OS X and a Windows DDM stand-alone on either Windows or Macintosh OS X machines. You make these stand-alones by checking the settings for each type of operating system on a separate page, and then simply clicking a button to start the stand-alone creation process, and (depending on the complexity of the DDM) have a cup of coffee. These executable programs can then be posted on the web, or compressed and posted; the DDM-Template has built into it the capability to access maps, images, and movies from http-capable file servers, or locally from CD, DVD, or hard disk.
The second major component of a DDM is a system of file directories that the DDM uses to access the many associated data and image files (Figure 11). If the access mode is "Local" (i.e., not from the web), the program assumes that these directories are in the "home" directory where the other directories are located. When accessing files over the web, the program looks for the same directory structure, but with reference to a "home" directory on a file server. Metadata, which consists of file names associated with map segments, correlation charts, cross sections, and figures is entered by the DDM-maker into text fields on a card in the DDM's "dataStack". Image and movie file names are entered directly into the scrolling field on the first (and only) card of the "Index of Images" stack.
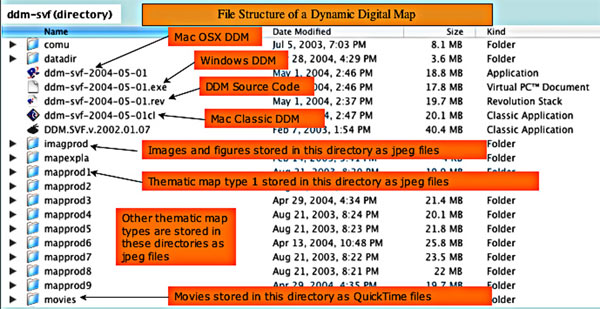
Figure 11. An example of the file structure for the DDM-SVF, showing directories and files in the "main" directory. The DDM-SVF application calls data from these designated directories and opens it into various windows designated for each.
The DDM-maker places map segment files into the correct directory for that thematic map type (in Figure 11, "mapprod1" to "mapprod9"). For example, let's suppose you had a geologic map divided into four tiles, one for each quadrant (NW, NE, SE, and SW), that were saved as the files named nw.jpg, ne.jpg, se.jpg and sw.jpg, respectively. These files, since they are all of the same thematic type (geology), would be stored in the directory "mapprod1". Next, suppose you also had an orthophoto map of the same area, divided into these same four tiles (essential, so that each pixel on both thematic types corresponds to a pixel of the identical location). Because the tiles in the orthophoto thematic map type encompass identical areas, you also name their files nw.jpg, ne.jpg, se.jpg and sw.jpg but place them in the directory "mapprod2". Additional thematic map-type tiles would be placed in sequentially numbered "mapprod" directories (for example, mappprod3, mapprod4, etc.). Files for images and movies are both placed in the "imagprod" directory), those for the Correlation of Map Units are placed in the "comu" directory), and so forth for several others not shown in Figure 11 (such as figures, map explanations ["mapex"], image thumbnails ["thumbdir"], etc.). Maps, images, correlation charts, figures, etc. are saved as jpeg files because they are a universal format across computer platforms, are reasonably compact, and transmit well across the internet. DDMs can magnify (zoom in on) map images and figures, and display them at half or quarter resolution, although at more than 2X, pixelation occurs quickly (except in QuickTime Virtual Reality movies).
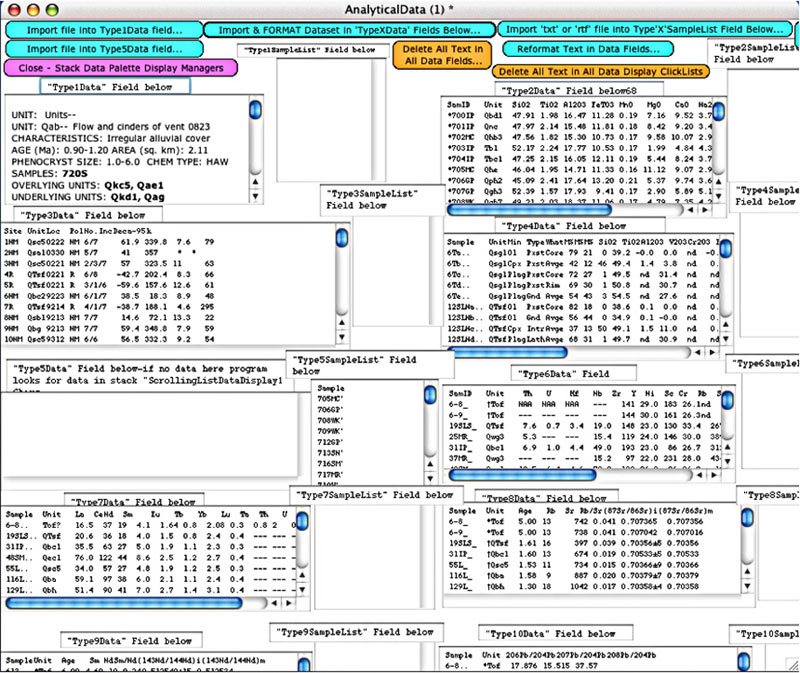
Analytical data are imported by the DDM-maker, from tab delimited text files into text fields in the DDM's "AnalyticalData" stack (Figure 12). Buttons (top, Figure 12) contain scripts that format the data so that it can be displayed in pop-up palettes, when the user clicks on a sample site or unit label. In most cases, up to nine analyses per data type can be displayed at one time. Unit descriptions can be displayed in either a single scrolling text field (like a word processor window), or in pop-up palettes (see Figure 6, top left), depending on the DDM-maker's preference. Each analytical data set (or all) can be saved to disk as text or tab-delimited text files using the "File / Save Data" menu selection.
DDMs make use of text field labels (for example, as sample site or unit labels), placed next to locations of map images or photo images to both open corresponding data and locate these labels on the map or image. These labels are stored in the program as part of an "overlay" group described in the next paragraph. The "Map" display stack and each of the nine image display stacks ("Image1" to "Image9") contain script that intercepts a mouse click on a text field label, and gets that object's name (an attribute that can be set to be the same as its text label). It then sends this name through script in the "AnalyticalData" stack that queries each type of analytical data field to see if an analysis with that site or sample ID is found. If so, it copies the data to a data display palette dedicated to that data type and displays it, and passes the query on to the next data type. Similarly, each of these stacks contain script that can locate the x and y coordinate of a selected text label and then scroll the map or image to center the object in the window. It also resizes an invisible red box to fit around the label and flashes it several times.
Each map and image file has a corresponding "overlay" (a group of labels), placed on a card in either the "MapOverlay" or "ImageOverlay" stack, one card per map or image (Figure 13). When a map (or similarly a digital photo) is opened by the user, the "Map" stack (or window) opens, and the map's jpeg file is called in from disk to fill an empty "image" object. Then the corresponding map's label overlay, containing the unit labels, sample sites, etc., is placed on top of that map's image object. Overlay labels are added to the DDM using DDM-Template's "ProjectModfier" palette, which, along with the Revolution interface, is the main set of tools for assembling a DDM. A map is displayed, and the DDM-maker creates and places labels in the correct locations on the map and uses a button in the "ProjectModifier" palette to add the object to the map's overlay group, and then saves it back into the program. Similarly, the DDM contains a palette (Figure 13, bottom right) that enables the DDM complier to create camera (or movie) icons with a specific number corresponding to a given image (found in the "Index of Images" palette), and add them into the map's overlay group.
 |
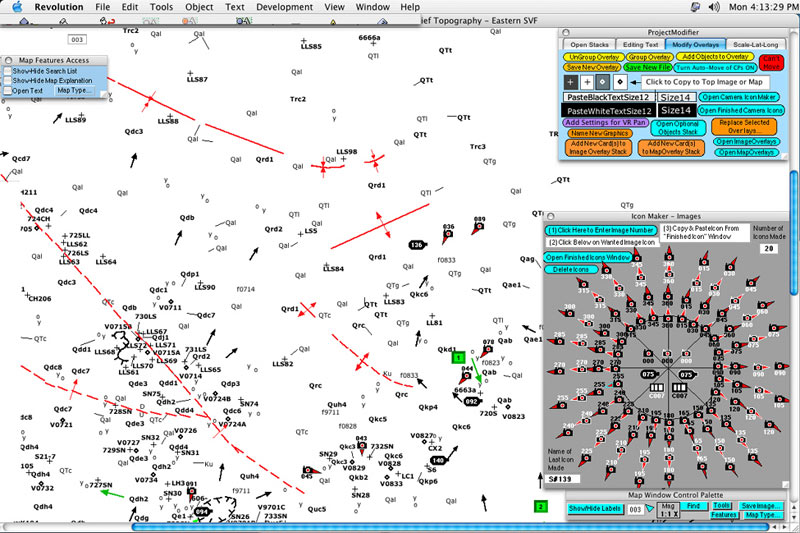 |
Figure 12. A DDM stores analytical data in text fields in a card in the 'AnalyticalData' stack, examples of which are shown here. The data are imported and formatted into the DDM using the buttons shown here. The input data comes from tab or comma delimited text files, such as you might save from Excel or other database programs. When a user selects a sample symbol on a map (or the sample click list), the data displayed is obtained from these fields. |
Figure 13. A "Map Overlay" composed of a group of map units and sample labels for the geologic map shown in Figure 6. A DDM stores map symbols, sample sites, and other graphic objects that the DDM-maker wants to have associated with locations on the map, as named vector objects. These are overlain on the map (or image) when it is opened by the DDM program. The DDM-maker can use the "Icon Maker-Images" palette (lower right) to place camera icons in the proper locations on the maps or images in the program. |
Three types of text components can be added to DDMs. The first involves modifying the DDM-Template's Indexes to reflect the content of the DDM under construction. The other two involve adding "Articles" (for example geologic summaries, map collar text, or guidebook articles), and captions (one for each image file).
Adding text to all indexes (except for the maps) involves simply following the format of the existing lines in the Template for a given index, and replacing them with your own content. First, the editor needs to use a button in the "Project Modifier" palette (not shown) to reset the index's text field so they can type into it. For example, each image you include is assigned a new, sequential "S#", entered in the first column. You enter the type of image (jpeg image or "IMG", QuickTime Movie or "QTM", or QuickTime Virtual Reality panoramic movie or "VRM") in column two, and in column three, enter the file name. All file names adhere to the "8.3" character convention, to ensure files that won't be garbled if you are using the web for access. The last column contains key words describing the image; this automatically becomes the title of the image window when the image is opened, and fills "Tool Tips" when a camera icon is "moused over". Other indexes can be filled the same way; when finished filling the index, you again use a button in the "Project Modifier" palette to reset the index's text field so you can use it to open files.
Captions can be written in your favorite word processor, and either pasted directly into one of the three different "user level" fields. Alternatively, and especially useful for heavily formatted text (for example, with numerous super- and sub-scripts), text files can be saved in "rtf" or, better yet, in "html" format out of your word processor, and imported, using the "Insert Formatted Text" button in the "imageCaptionData" stack. Each caption is preceded by the file name and two dashes, with the caption ending in a carriage return, as you would a paragraph. Depending on the "user level" chosen by the user, the caption, when requested, is copied out of one of these fields and inserted into the floating "Image Caption Palette" that can be opened when an image is displayed.
Likewise, text for Articles can be imported from word processor files that were saved in html or rtf format. Each article can be entered into from one to three different fields, corresponding to different user levels. The Article" palette (lower left, Figure 14) entitled Field Guide to the SVF", contains some underlined words in bold type that, when selected, will automatically invoke a response. The underlining shows that I have set these letters in Revolution to be "linked" text, to start this chain of events. For example any linked text starting with "http://" will automatically open your default web browser to that URL, as will links starting with "www". Likewise, a link that starts with the symbols "S#" will automatically open that image or, if "alt-clicked", will search for that image icon in an open map or image (as will a link starting with "Stop" and ending in a two digit number). Other symbols will likewise open other objects not described in this article (F# for figures, CC for Correlation Charts, XC for cross sections). The Cookbook describes how, with some simple scripting applied to the "Article" palette, you can do other things with these links (like open animations, etc.).
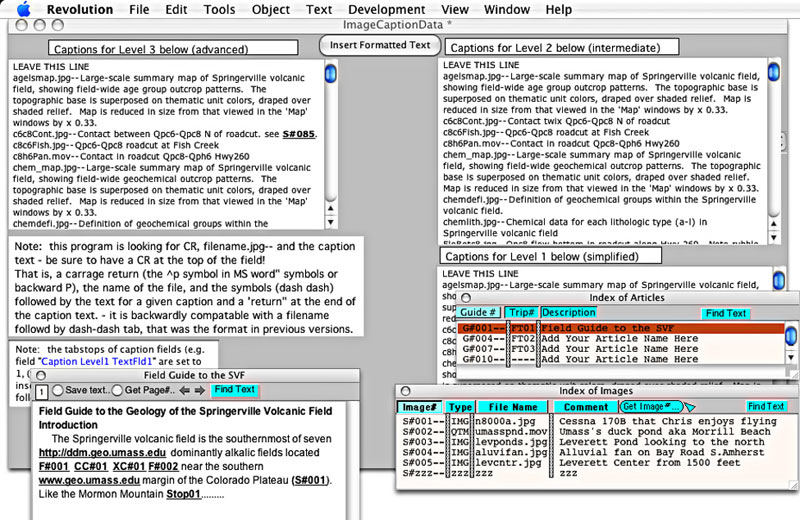
Figure 14. Examples of text data components of DDMs, shown in four stacks. Here, for example, figure or image captions and geologic summaries or guidebook articles are stored in the DDM-Template. They are put there by either cutting them from word processor documents and pasting them in specified places in the Template, or by importing formatted text (in html format) using buttons installed in the Template.Click on thumbnail to view full-size image.
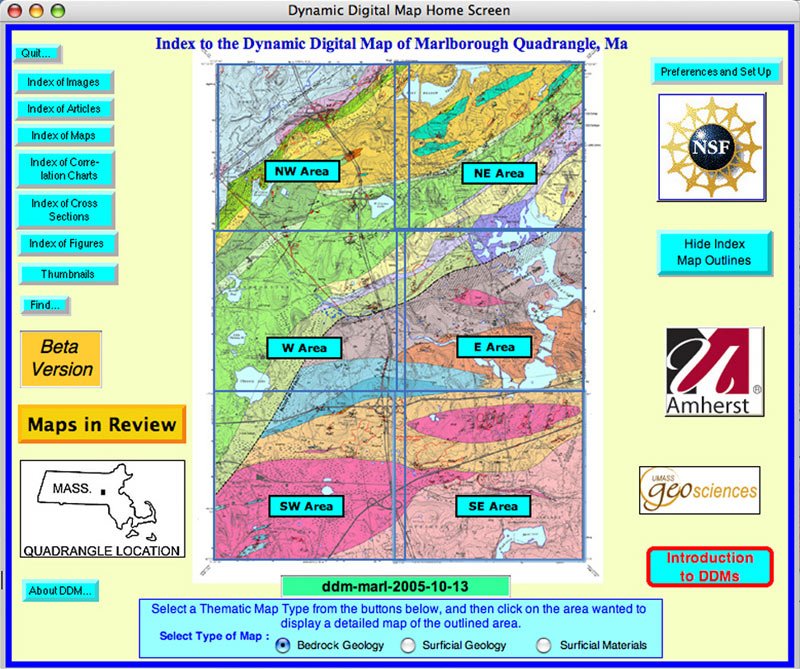
The Office of the Massachusetts State Geologist faces the task of making maps easily accessible to citizens in the most efficient and expeditious manner possible. Many of these potential users have neither the expertise nor software to use a GIS product, but have the basic computer skills to use an integrated stand-alone product such as the DDM. To accommodate that need, the Office is experimenting with the release of a preliminary version of the Marlborough Quadrangle of Massachusetts as a DDM (Figure 15).
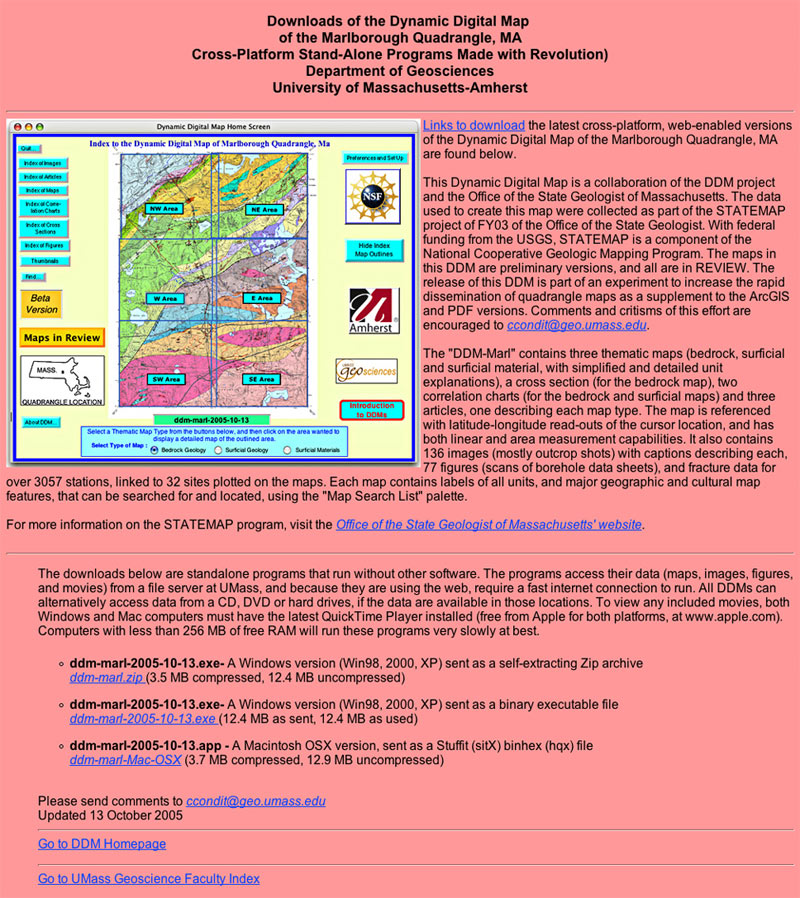
A click on the proper link at the DDM-Marl web site (Figure 16, http://ddm.geo.umass.edu/ddm-marl/) will download a version of the software appropriate for the user's computer. Provided the user has a fast web connection, they can then use the "Web Access" button to open maps, image, figures, etc. from the web server located at the University of Massachusetts. The DDM can also be distributed on CD, DVD, or USB flash-memory device, for use without web access. All maps, data, images, and figures can be saved out of the program to the local computer's hard drive, and printed for hard copy use.
The "DDM-Marl" contains three thematic maps (bedrock geology [Figure 17], surficial geology, and surficial material, with simplified and detailed unit explanations), a cross section (for the bedrock map), two correlation charts (for the bedrock and surficial maps) and three articles, one describing each map type. The map is referenced with latitude-longitude read-outs of the cursor location, and has both linear and area measurement capabilities. It also contains 136 images (mostly outcrop photographs) with captions describing each, 77 figures (scans of borehole data sheets), and fracture data for over 3057 stations, linked to 32 sites plotted on the maps. Each map contains labels of all units, and major geographic and cultural map features that can be searched for and located, using the "Map Search List" palette (lower right, Figure 17).
 |
 |
| Figure 15. Home screen of the Dynamic Digital Map of Marlborough (DDM-Marl). The maps in this DDM are saved as one continuous jpeg image; the map view simply scrolls to the selected part of the map. The jpeg images are 2821 pixels wide by 3836 pixels high. Comfortable transmission rates of reasonably good quality images, with file sizes of about 2.5 MB, are possible via the web. Better quality maps, that is, with less lossy compression, are supplied via CD or DVD. |
Figure 16. Web page for the DDM-Marl. The Office of the Massachusetts State Geologist is experimenting with using DDMs as one mode of distributing geologic maps and associated data. This map can be accessed from the URL http://ddm.geo.umass.edu/ddm-marl/. The user can download the application that matches their operating system, and access the maps, images, etc. via a fast web connection using this method. |
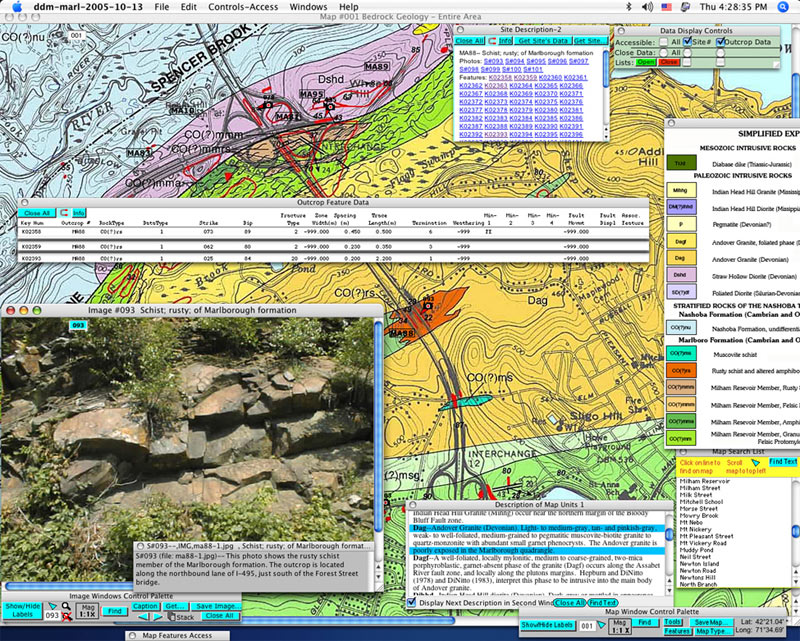 |
Figure 17. Bedrock geology map of the Marlborough Quadrangle, one of three thematic maps comprising the Dynamic Digital Map of Marlborough, MA. Note the latitude-longitude read-out capability (lower right) for the cursor location, and the "Map Search List". A click on a feature's name in the List will center the map on it. A simplified Explanation of Map Units for the bedrock map (right, center) and the complete text describing units (lower right) are displayed. A click on a unit's box in the Simplified Explanation will center the map on that unit symbol. An alt-click on it will open the more detailed description. Fracture data for given sites also are shown (center). The "Data Display Controls" palette lets the user open and close these palettes quickly, or select which types of data to display when a site is selected on the map. A photograph of one of the sites (camera icon 093, center) is shown in the lower left, with its figure caption. |
DDMs provide a self-contained way to distribute map products that can be tightly integrated with associated data, text and multimedia products. DDMs are made using the programming environment Revolution, from an open source "DDM-Template" or shell program. Using this shell, into which the map builder inserts their own text, analytical data, and metadata, the final DDM application can then access the media from a file structure on the local computer or via the web. Once assembled in Revolution, the mapmaker can, in a single step, create these cross-platform stand-alone applications for Windows, Macintosh, Linux and other Unix operating systems. These DDMs are web-enabled, intuitive to use, easily searchable, and require no additional proprietary software to operate. Examples of more than 10 DDMs can be downloaded from links at the web site, http://ddm.geo.umass.edu, where you can also download the DDM Cookbook in pdf format, and the DDM-Template. Trial versions of Revolution can be found at www.runrev.com.
Condit, C.D., 1999, Components of Dynamic Digital Maps: Computers & Geosciences, v. 25, p. 511-522.
Condit, C.D., 1995a, DDM.SVF: A prototype Dynamic Digital Map of the Springerville volcanic field, Arizona: GSA Today, v. 5, p. 69, 87-88.
Condit, C.D., 1995b, Dynamic Digital Map: The Springerville Volcanic Field: Prototype color digital maps with ancillary data: Geological Society of America Digital Publication Series DPSM01MC (CD-ROM for the Macintosh), v. 4.10.95, 36.7 megabytes.
Condit, C.D., and Albrecht, T.R., 2005, A Cookbook for Dynamic Digital Maps, 68p., available at http://ddm.geo.umass.edu/Cookbook2005-08-12.pdf.
Condit, C.D., Crumpler, L.S., and Aubele, J.C., 1999, Lithologic, age-group, magnetopolarity and geochemical maps of the Springerville volcanic field, east-central Arizona: U.S. Geological Survey Miscellaneous Investigation Series Map I-2431, scale 1:100,000, 5 sheets, available at http://geopubs.wr.usgs.gov/i-map/i2431/.

![]() U.S. Department of the Interior |
U.S. Geological Survey
U.S. Department of the Interior |
U.S. Geological Survey
URL: pubsdata.usgs.gov /pubs/of/2005/1428/condit/index.html
Page Contact Information: David R. Soller
Page Last Modified: Saturday, 12-Jan-2013 22:05:50 EST
