U.S. Geological Survey Open-File Report 2005-1428
Digital Mapping Techniques '05—Workshop Proceedings
Three dimensional (3D) geological models represent an advanced synthesis of different kinds of data (geological and geophysical, surface and subsurface data). This is useful to obtain a geological vision more realistic than a 2D map, and to perform complex analyses and computations on the geological framework.
The accumulation of geological information in digital form has introduced the possibility of applying geographical information system technology to the field geology. To achieve the benefits in information management and in data analysis and interpretation, however, it is necessary to develop spatial models that are specifically designed for working in three dimensions. An overview of examples for various geological settings and scale were elaborated with different software and the analysis technique described below.
The goal of the national project on 3D Geological Cartography of Italy, carried out by LINEE (Laboratory of Information-technology on Earth and Environment) and the Italian Geological Survey with collaboration of ENI and Midland Valley Exploration, is to study, represent and better understand the relationship among geological features (stratigraphy, structures, geomorphology, etc.) by using new tools for 3D geological modelling (Slatt et al., 1996; De Donatis, 2001).
The selected area is contained within Sheet 280 Fossombrone (SGN-Italian Geological Survey , scale of 1:50,000 Figure 1) which was surveyed by the SGN with the collaboration of the Universities of Urbino and Siena, for the new Geological Map of Italy Project (CARG CARtografia Geologica). The in-depth knowledge of the regional and local geology combined with the availability of subsurface (well and seismic by ENI-Agip) data makes the area ideal for defining a suitable methodology for creating a 3D geological model for other areas of Italy (De Donatis et al. 2002).
Figure 1. Location Map of Italian Geological SurveySheet 280-Fossombrone.
The field geological map (Figure 2) and the CARGtype database (Figure 3) were integrated by geophysical data (seismic profiles calibrated with well logs) in order to build a series of parallel cross-sections. For the topographic surface, a DEM was developed from the new detailed Technical Map of Regione Marche, at the scale of 1:10,000. The later was used as the base upon which the geological boundaries were draped, and the geologic units were colored, to show the geology in 2.5 dimensions (Figure 4).
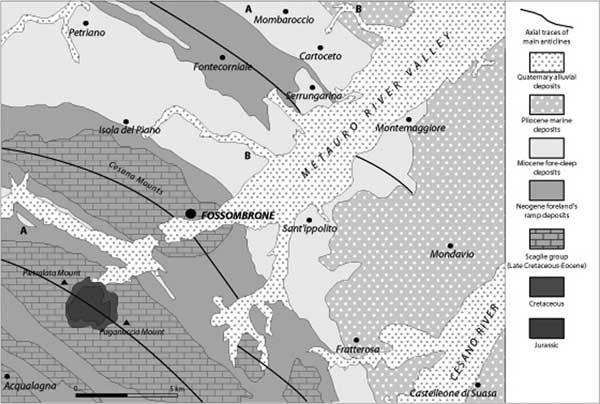
Figure 2. Geological sketch map of Sheet 280.
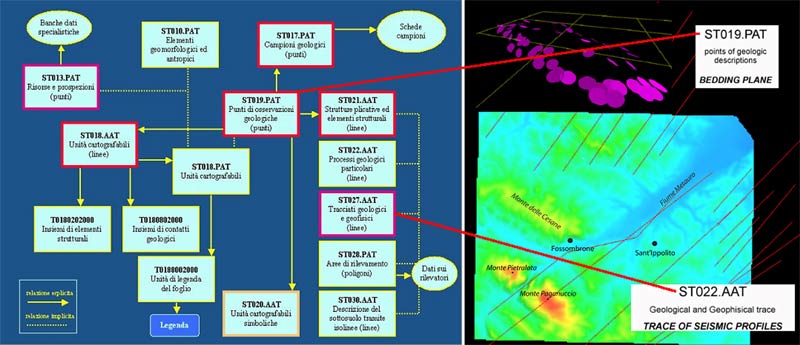
Figure 3. The CARG (CARtografia Geologica: Geological Cartography) database.
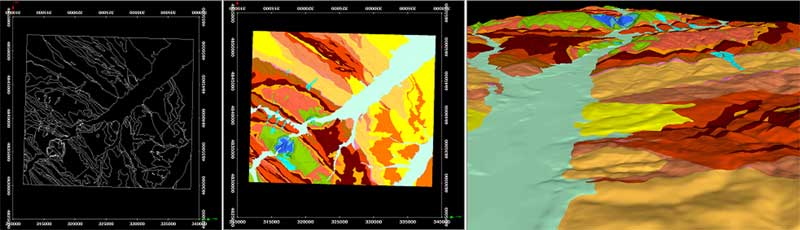
Figure 4. Combining geology and the DEM, to show geology in 2.5 dimensions.
The interpreted seismic profiles (Figure 5a) were time-depth converted and, integrating field data, a number of georeferenced geological cross-sections were built using 2DMove (Figure 5b) and imported into the 3DMove environment (Figure 5c).
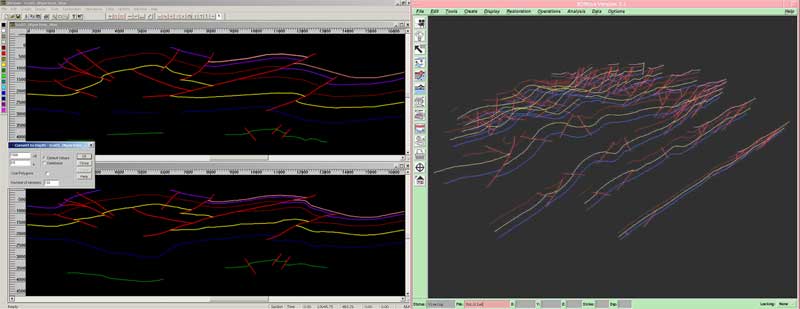
Figure 5. Construction of geological cross-sections (left windows) and importing into 3D environment (right window).
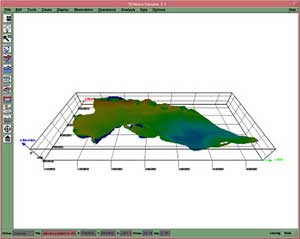
By correlating lines between cross-section, the 3D surface of each geological horizon was developed. These were edited many times, in order to ensure a coherent, integrated data set. The result of this work is the geological model shown in Figure 6. Figure 7 shows details of the top of the Furlo Gouge structure, and its 3D form (this feature is located in the western part of the map area).
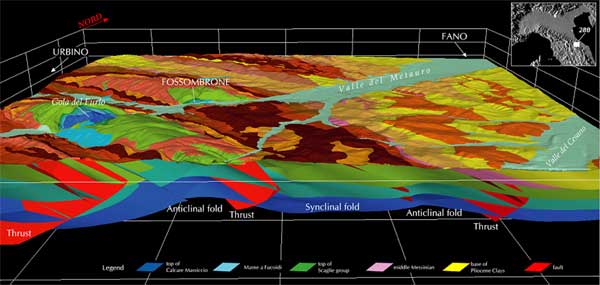
Figure 6. The 3D geological model of Sheet 280-Fossombrone in a perspective view from the south.
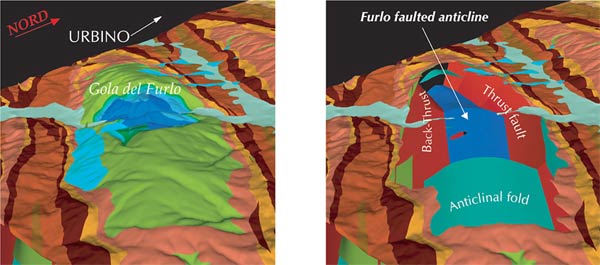
Figure 7. Detail of the structure at the Furlo Gouge, at land surface (left diagram) and at depth (right diagram), in the western part of the map area, near Urbino.
The aim of this study was to build a 3D geological model using subsurface data, using more then 700 logs. Every log was digitised and interpreted. A geological database was built in a GIS environment. After we imported the log data into Voxel Analyst software, we could also compute data by the means of three dimensional geostatistical methods.
We accomplished the following:
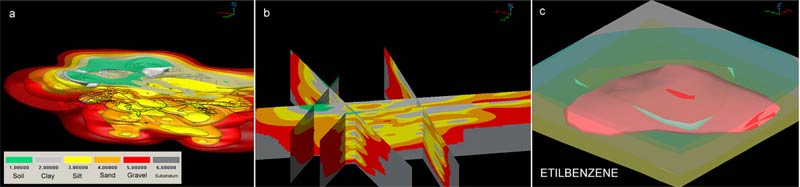
Figure 8. 3D geostatistical model of the lithological bodies with different grain size (see legend in 8a) of the Foglia river valley (8a); some cross sections (8b); and a hydrocarbon pollution plume (8c) in the porous media (sand and gravel deposits).
The 3D geological modelling has also been applied for hydrogeological characterization to an area in Lombardia, around the Po River Plain. Data, coming from a previous subsurface map publication by Regione Lombardia in collaboration with ENI, were georeferenced and all the contour lines were assigned an altitude (z) value. We imported the data into two different software (3DMove by Midland Valley Exploration Ltd and Voxel Analyst by Intergraph) in order to develop horizon surfaces (Figure 9a and b) and the volumes between the surfaces. This model allowed us to better assess volumes and to build flux models by attributing parameters such porosity, permeability, etc.
 |
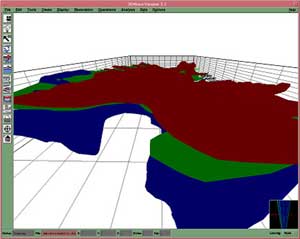 |
Figure 9. 3D geological model showing the horizons of sequence-tops bounding the three principal aquifer groups in the Lombard sector of the Po Plain. Total view of the model from South (9a), and view from East (9b). |
|
The main purpose of this three-dimensional model was to better understand the geodynamics of the South Scotia Ridge (SSR), a submerged structural high representing the eastern continuation of the Antarctic Peninsula at sea, and one of the major transcurrent plate boundaries on Earth. The SSR runs approximately E-W for about 500 km, separating the oceanic Scotia Plate from the Antarctica Plates, and mainly composed of fragments of continental crust. The seismic lines that we used (Italian campaigns IT91 and IT95 onboard the R/V OGS-Explora) were collected mainly orthogonal to the geological structure.
The interpreted seismic lines were digitised and acquired in a format useful for processing with 2D-Move and 3D-Move software packages. After georeferencing and converting from travel-time to depth, geologic horizons recognised from the network of seismic lines were correlated in three dimensions with boreholes, to create the 3D model (Figure 10).
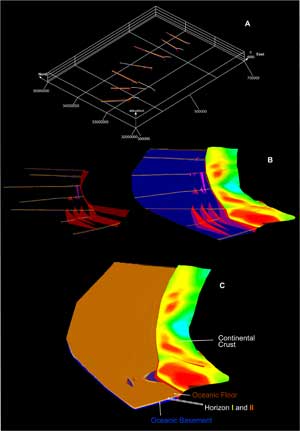
Figure 10. Construction phases of 3D model of South Scotia Ridge. Geological sections geo-referenced in the 3D virtual space (10a). Creation of surfaces representing geological and structural elements (10b). Complete 3D model showing oceanic basement, faults, horizons I and II, Oceanic floor and DEM of the continental crust (10c).
The ability to collect, visualize and analyse spatially-accurate surface and subsurface datasets in three-dimensions gives us new opportunities to capture and interpret three-dimensional geological architectures. This method brings new research opportunities allowing:
De Donatis, M., 2001, Three-dimensional visualization of the Neogene structures of an external sector of the Northern Apennines, Italy: AAPG Bulletin, v. 85, no. 3, p. 419-431.
De Donatis, M., Jones, S., Pantaloni, M., Bonora, M., Borraccini, F., Gallerini G., and DAmbrogi, C., 2002, A National Project on Three Dimensional Geology of Italy: 3D model of Monti della Cesana from Sheet 280 Fossombrone: Episodes, March 2002, p. 29-32.
Slatt, R.M., Thomasson, M.R., Romig, P.R., Pasternack, E.S., Boulanger, A., Anderson, R.N., and Nelson, H.R., 1996, Visualisation Technology for the Oil and Gas Industry: Today and Tomorrow: AAPG Bulletin, v. 80, no. 4, p. 453-459.
See also http://www.uniurb.it/ISDA/Linee/linee.html.

![]() U.S. Department of the Interior |
U.S. Geological Survey
U.S. Department of the Interior |
U.S. Geological Survey
URL: pubsdata.usgs.gov /pubs/of/2005/1428/dedonatis2/index.html
Page Contact Information: David R. Soller
Page Last Modified: Saturday, 12-Jan-2013 22:05:56 EST
