U.S. Geological Survey Open-File Report 2005-1428
Digital Mapping Techniques '05—Workshop Proceedings
logical Survey (ISGS) has been to digitally map the geology of the state from the land surface to the bedrock surface, using USGS 7.5-minute (scale 1:24,000) topographic quadrangles as the fundamental mapping area. Principal map themes include surficial geology, bedrock geology, bedrock topography, and drift thickness. Additional themes are included depending upon the resources and needs of each area.
Initiated in 1993, the STATEMAP program is funded in part by federal appropriations to the U.S. Geological Survey and is a component of the National Cooperative Geologic Mapping Program. Over the past ten years, ISGS has compiled 65 quadrangle-based geologic maps for STATEMAP, but more than one-half of them remain unpublished, due to lack of sufficient staff and inefficiencies in map production.
This paper reviews the procedures implemented during the past three years at ISGS for improving the quality and efficiency of geologic quadrangle map production. An overview of large-scale USGS digital base map products currently in use at ISGS is presented first, followed by a discussion of new cartographic standards being developed for geologic mapping. Finally, I present a summary of how software use and production work flow modifications have impacted the efficiency of the ISGS map production process.
The selection of an appropriate base map has been an important element in our geologic mapping program. Two categories of large-scale digital spatial data are currently used at ISGS for map production: a) USGS Digital Line Graph (DLG), and b) USGS Raster Feature Separates (RFS).
ISGS has used large-scale USGS DLG data for approximately 15 years. DLG data are comprised of vector data digitized from 7.5-minute topographic quadrangle maps, with updates conducted using National Aerial Photography Program (NAPP) or NAPP-like aerial photography. The resulting vector data produce high quality line work that is used as the base for geologic quadrangle maps. The various primary map features are contained in separate, topologically structured layers, thus allowing for selection or omission of features to be shown with the geologic map information. DLGs must first be converted to a data format compatible with GIS software, and the feature types within each layer must be coded and symbolized to recreate the appearance of the published topographic quadrangle map. Most features in DLG files do not have place name attributes, so usually the black feature text is scanned from a USGS mylar feature separate to produce a raster text layer for the geologic quadrangle map. DLG files require significant processing (approximately one week) with even an experienced GIS analyst before they can be utilized as the primary base for a geologic quadrangle map.
The availability of large-scale DLG data for Illinois is limited, and a majority of the quadrangles have no DLGs at all. In the past, updating of some of the more critical DLG feature layers, e.g. hypsography, hydrography, transportation and PLSS, could be produced at the USGS for approximately $7,500 for each quadrangle. Because the DLGs do not include cartographic text, a copy of the the mylar feature separate for the cartographic text has also been purchased at a cost of $60.00 for each quadrangle.
As of August 2003, copies of the mylar feature separates were withdrawn for purchase from the USGS. In addition, creation of new 7.5-minute DLG data at the USGS has ceased, but existing DLG data will continue to be available for purchase through EarthExplorer (http://edcsns17.cr.usgs.gov/EarthExplorer/). As of July 2005, individual 7.5-minute DLG data layers will only be accessible through a new USGS Tiled Data Delivery System (TDDS) that will be a component of the Seamless Data Distribution System (http://seamless.usgs.gov/).
ISGS continues to use DLG data for those 7.5-minute quadrangles that are currently available, but an alternative map base must be used for the quadrangles for which no DLG data exist. When a USGS quadrangle map is revised, typically the original mylar feature separates are scanned at 1,000 dpi and updated using raster revision methods. The resulting Raster Feature Separates (RFS) data files can be used to create press negatives for printing, or can be combined into a single Raster Color Composite (RCC) file. These RCC data files are also used for the creation of a Digital Raster Graphic according to the USGS revised DRG product standard implemented in October, 2001 (http://topomaps.usgs.gov/drg/drg_standard_change.html).
RFS data files can also be produced directly from the mylar feature separates without any revision. In this situation, the RFS and RCC files will be identical to the most current published edition of the 7.5-minute quadrangle map. The cost of RFS and RCC data files for a single quadrangle may range between $700-$1,200, depending upon the number of original map feature separates. The resulting RFS and RCC data are delivered as both 1,000 dpi and 500 dpi resolutions in GeoTIFF format, and can readily be used in GIS software systems. USGS standards for RFS data are available at http://rockyweb.cr.usgs.gov/nmpstds/rfsstds.html. Currently, RFS products are produced using a full-repay funding agreement with the USGS, which means that the user must pay the entire production cost, and this situation is not likely to change in the near future. The USGS RFS product provides a base map that is high resolution, affordable, and easy to use (Figure 1).
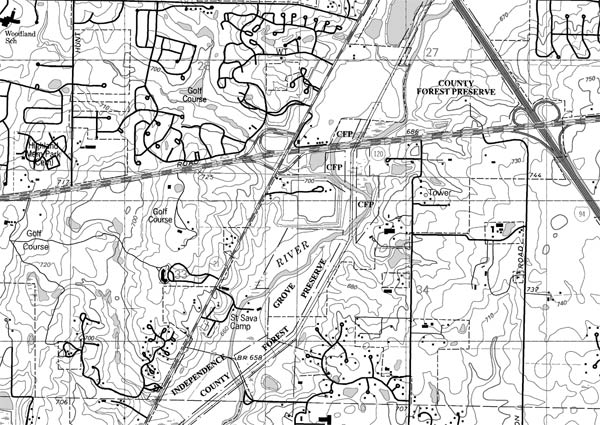
Figure 1. Raster Color Composite (RCC), with green, pink, and gray features layers removed, from Libertyville, IL 7.5-minute quadrangle.
Early attempts at ISGS in the digital production of geologic quadrangle maps involved experimenting with a number of GIS and graphics software programs. Cartographic standards and map layouts were inconsistent. Originally, compilation of the geology began using GIS and was completed in a graphics program, where changes were made without updating the GIS data files. During the past few years there have been significant changes in the map production process at ISGS that have helped to increase efficiency and consistency of the geologic quadrangle maps.
The software programs used at ISGS for creating geologic quadrangle maps are ESRI ArcGIS, Adobe Illustrator, InDesign and Photoshop, and Avenza MaPublisher. The geological units, data points and other geologic features are compiled and symbolized in ArcMap. The completed geology is exported from ArcMap to an Illustrator file, where final adjustments to color and label placement are completed. When necessary changes are made to the geologic features of the map, they are first created in the GIS data file and subsequently re-exported as an updated Illustrator data file. DLG base maps are also coded and symbolized in ArcMap and then exported to an Illustrator file. RFS base map files are converted to bitmap mode files in Photoshop before being placed into Illustrator file format via MaPublisher. All other components such as legends, stratigraphic columns, cross sections and other figures are accomplished using Illustrator. Once the individual Illustrator components are completed as .eps files, they are placed in Adobe InDesign for final layout of the map sheets (Figure 2).
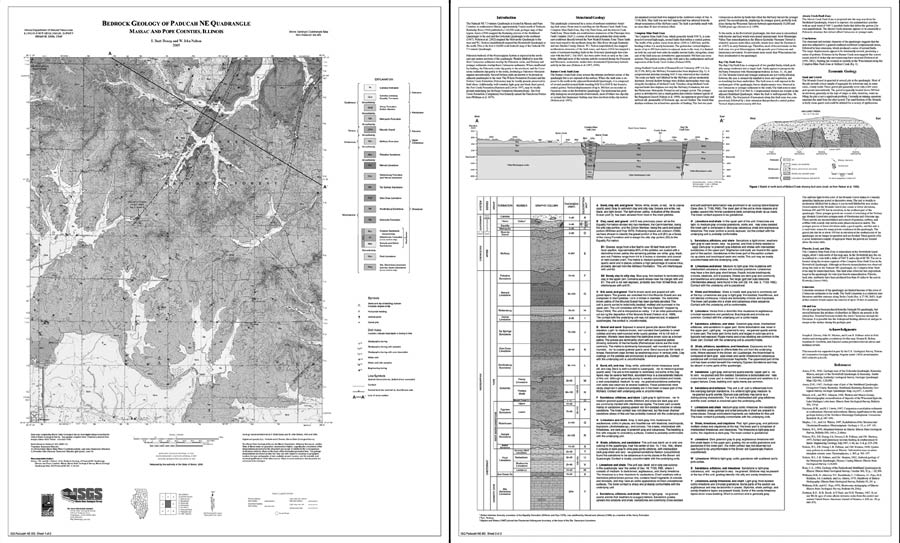
Figure 2. Map components created in Illustrator are placed into InDesign for final layout.
A number of organizational efforts have improved the efficiency of map production at the ISGS. All of the digital data for each geologic quadrangle map are maintained in one location and are organized and named in a consistent manner, thus facilitating the map production procedures. GIS data files are retained as an ArcGIS geodatabase, within which all map editing is completed. A geodatabase template is under development at ISGS that will increase efficiency in map production and also facilitate the movement of mapped data into a statewide geology geodatabase to be available in the future.
In order to maintain a focused effort in the production of each geologic quadrangle map, all of the map compilation is conducted at ISGS by only one or two GIS/graphics personnel, in addition to several GIS/graphics student interns under the direction of the staff cartographer. The cartographer closely monitors all maps currently in production, the staff who are working on each quadrangle map, the stage of review, and what is required to move it on through to publication. The review progress of each geologic quadrangle map is available on-line to all ISGS staff.
Because there are new student interns joining the map production each academic year, there has been a need for detailed documentation for all mapping procedures. Internal documents are now available to interns, new GIS/graphics staff, or to geologists with instructions for each of the procedures involved in creating and producing a geologic quadrangle map. These internal documents, along with sample components and map layouts, will be publicly available on-line by December, 2005, at the ISGS website (http://www.isgs.uiuc.edu/). Such documentation has greatly reduced the amount of time spent training staff in mapping procedures and ensured a more standardized format. This on-line documentation will also be a resource for university geology departments who are participants in the USGS EDMAP program and would like to make use of the mapping standards developed at the ISGS.
A number of standards have been created at ISGS for use in the geologic quadrangle mapping program, and include the following:
Geologic quadrangle maps are published in the ISGS Illinois Geologic Quadrangle (IGQ) map series. As of July 2005, a total of 50 IGQ maps had been published since the series was established in 1999. Geologic quadrangle maps that are produced for the STATEMAP program are created in one year, and usually these maps have not gone through IGQ review when they are delivered to USGS as a STATEMAP product. In part to facilitate STATEMAP production, the ISGS established the Illinois Preliminary Geologic Map (IPGM) series in 2004, and a total of 29 IPGM maps have been produced as of July, 2005. IPGM map products are created using the same compilation, cartographic and graphic standards as the IGQ map series, but IPGM maps differ in that they have not completed the full review and revisions necessary for IGQ publication. Many of these IPGM maps will eventually be published as part of the IGQ map series, and in the meantime they are publicly available on-line (see Related Information below).
Domier, J. E., 2003, Retiring of the USGS map separates and the emergence of the USGS raster feature separates: presentation at Illinois Mapping Advisory Committee meeting, November 28, 2003, Springfield, Illinois, http://ngmdb.usgs.gov/Info/dmt/docs/domier03.html.
Domier, J. E., 2005, Geologic Quadrangle Mapping at the Illinois State Geological Survey: presentation at Digital Mapping Techniques Workshop, April 26, 2005, Baton Rouge, Louisiana, http://ngmdb.usgs.gov/Info/dmt/docs/domier05.ppt.
Illinois Geological Quadrangle (IGQ) Digital Data Products, Illinois Natural Resources Geospatial Data Clearinghouse, http://www.isgs.uiuc.edu/nsdihome/ISGSindex.html.
ISGS On-Line Geologic Quadrangle Maps (.pdf files), http://www.isgs.uiuc.edu/isgshome/online_maps_data.htm.
ISGS Cartographic Standards for ISGS Geologic Quadrangle Mapping, http://www.isgs.uiuc.edu/ (available fall 2005).
USGS Digital Line Graphs, http://edc.usgs.gov/products/map/dlg.html.
USGS Standards for Raster Feature Separates, http://rockyweb.cr.usgs.gov/nmpstds/rfsstds.html.

![]() U.S. Department of the Interior |
U.S. Geological Survey
U.S. Department of the Interior |
U.S. Geological Survey
URL: pubsdata.usgs.gov /pubs/of/2005/1428/domier/index.html
Page Contact Information: David R. Soller
Page Last Modified: Saturday, 12-Jan-2013 22:05:59 EST
