U.S. Geological Survey Open-File Report 2005-1428
Digital Mapping Techniques '05—Workshop Proceedings
Many reasons exist for making detailed geologic maps, including addressing basic research problems, mineral and hydrocarbon exploration and development, location of low value resources, and for foundations of engineered structures. Some use geologic maps at 1:24,000 or larger scale to combine small areas into islands of knowledge that permit addressing larger-scale problems. With reconnaissance mapping we frequently can extrapolate between islands of knowledge, in order to compile smaller-scale geologic maps. The important point, however, is that detailed geologic maps at 1:24,000 scale or larger form the basis for high quality geologic basic or applied uses.
Large numbers of detailed geologic maps the were not produced by State or Federal agencies are stored (not formally archived) in geological survey and university faculty file drawers, in theses and dissertations in university libraries, in engineering reports, mining and petroleum companies, and elsewhere. These are mostly not digital geologic maps. Numerous archived detailed geologic maps are of areas that now are inaccessible through urbanization or through concealment beneath various kinds of engineered structures, or are in flooded mines and abandoned oil fields. These maps constitute valuable data sets that should be preserved and made available to the geologic community. Conversion of these maps to digital geo-referenced GIS maps and databases is possible, with adequate time and funding. At the very least, they could be scanned and made available as georeferenced images. The map categories identified here should be subjected to a quality filter before the digitization process begins.
There are several categories of non-federal, non-state, non-digital geologic maps. Some are published at small scale in journals and survey publications. In addition to the maps listed above, many detailed geologic maps were made during the 1970s and 1980s when nuclear power plants were being constructed, and these reside in the archives of the Nuclear Regulatory Commission. They also should be digitized and made more widely available. Detailed geologic maps of dam, building, and non-nuclear power plant foundations and parts of other engineered structures should similarly be digitized.
The primary utility of digital geologic maps is virtually the same as that of paper geologic quadrangle maps. They contain the primary geometric, spatial, and resources data useful for crustal and surficial geologic research, and mining, petroleum, engineering, and environmental applications. In addition however, digital geologic maps provide the ability to quickly and easily add data, and to revise maps while they are being constructed. Editorial changes also are readily incorporated and, in addition, there is greater ease in integrating geologic maps into local or regional compilations if they are in digital format. Moreover, computer systems that allow geologists to record attribute and spatial (GIS) data in the field provide a more effective means of migrating field observations and mapping into a formal, published map database.
Our process of converting paper to digital geologic maps requires scanning the paper version and re-compiling it on a geo-referenced base in Adobe Illustrator or another graphics program. Adobe Illustrator is preferred because the add-on program MaPublisher permits geo-referencing maps at the beginning of digitizing. The map can be printed as a draft and edited, then the editing incorporated into the digital file. The map explanation can most conveniently be assembled in the graphics program. The geo-referenced map can be brought into a GIS for addition of other attributes and data.
A digital raster graphic (DRG) or digital line graph (DLG) file of the base map is obtained and opened in Adobe PhotoShop. The basic colors in the map file are converted to black or some other background color, and the PhotoShop document is saved. The base map file can then be opened in Adobe Illustrator and geo-registered using MaPublisher. An advantage to approaching geologic mapping this way is that it permits geologic contacts to be compiled daily, on-screen, in Adobe Illustrator layers, and lithologic, resources, and structural data to simultaneously be compiled onto the map and into a spread sheet. Once mapping is complete and contacts are drawn, polygons can be constructed to complete the geologic map. Finally, the title, explanation, scale, coordinates, etc., can be added to the margins of the map.
The digital geologic map can then be converted to GIS format by using MaPublisher Adobe Illustrator to create georegistered shape files of the geology and the base map. The shape file can then be converted to an ArcGIS file. The geologic attribute data for points, lines, and polygons can be created as a separate file and incorporated in ArcGIS.
The examples below are taken from my and my students' work, because of ready access to our detailed geologic map data accumulated over >40 years of geologic mapping (Figure 1). Many of these maps remain in paper or mylar format in file drawers and theses, or have been published on paper (e.g., Hatcher, 1980; Hatcher and Acker, 1984; Ausburn et al., 2000), but a decision was made by myself during the mid-1990s to begin making digital geologic maps. In addition, we have been converting older non-digital maps as opportunities arise. As a result, close to 50 percent of the detailed geologic maps we have made over the past 40 years are now digitized, and this process continues (Figure 2).
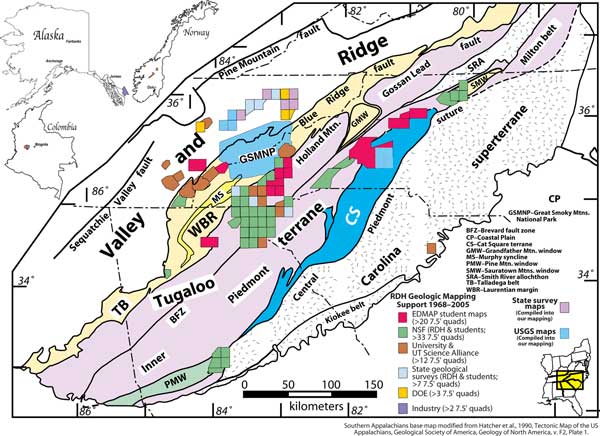
Figure 1. Index map of geologic mapping by RDH, undergraduate, and graduate students since the late 1960s, and funding sources [a more legible color version of this figure is available at http://ngmdb.usgs.gov/Info/dmt/docs/hatcher05.html]. EDMAPEducational component of the USGS-managed National Cooperative Geologic Mapping Program. NSFNational Science Foundation. UTUniversity of TennesseeKnoxville. DOEU.S. Department of Energy.
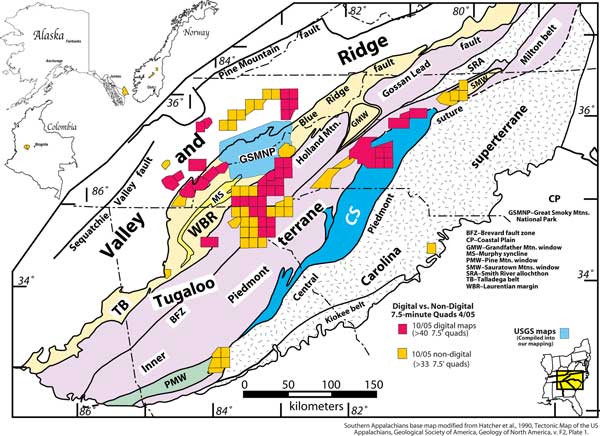
Figure 2. Index map showing digital (red) vs. non-digital (yellow) compiled geologic maps [a more legible color version of this figure is available at http://ngmdb.usgs.gov/Info/dmt/docs/hatcher05.html].
The central part of the Columbia 7.5-minute quadrangle, Tennessee (Wilson et al., 1964; Figure 3) was mapped during 1962 as one of the first mapping projects in my career. It contains a topographic high in the central part of the quadrangle that preserves some locally complex and regionally important geologic relationships that were not appreciated until around 2000. Because of this, the geologic map of the central part of the quadrangle has been digitized (Figure 3). The geologic data remain good: contacts were correctly mapped and structural data were correctly measured and plotted. So, despite the fact that the data were collected in the early 1960s, understanding their regional geologic significance did not occur until recently. Beneath the Fort Payne chert (early Mississippian) is an unconformity that terminates a faulted syncline. This structure provides important evidence that the middle Paleozoic Neoacadian (360-350 Ma) orogeny affected both the southeastern Appalachians and adjacent craton. In addition, truncation of faults, synclines, and anticlines here and elsewhere (e.g., Wilson, 1971) beneath the unconformity provides a new model for hydrocarbon plays and exploration in the Middle Ordovician Nashville - Stones River Groups (Trenton - Black River ages) farther east beneath the Cumberland Plateau in Tennessee and southern Kentucky.
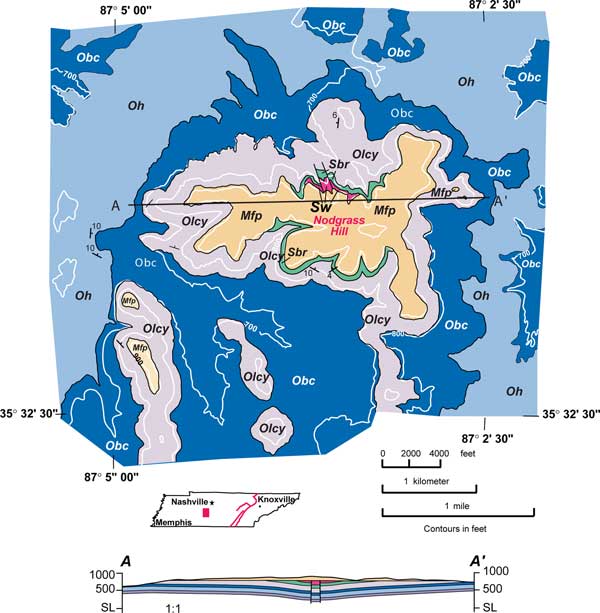
Figure 3. Geology of the central part of the Columbia, Tennessee, quadrangle (after Wilson et al., 1964) [a more legible color version of this figure is available at http://ngmdb.usgs.gov/Info/dmt/docs/hatcher05.html]. Oc - Carters Limestone (shown in cross section only; Middle Ordovician). Oh - Hermitage Formation (Middle Ordovician). Obc - Bigby-Cannon Limestone (Middle Ordovician). Olcy - Leipers Formation and Catheys Limestone, undivided (Middle and Upper Ordovician). Sbr - Brassfield Limestone (Lower Silurian). Sw - Wayne Group, undivided (Lower Silurian). Mfp - Ft. Payne Formation and Chattanooga Shale, undivided (lower Mississippian).
Geologic mapping of the Prentiss 7.5-minute quadrangle, North Carolina, was completed during the 1970s. The Prentiss quadrangle is published on paper (Hatcher, 1980), and was recently digitized from scanned raster images of the original paper maps (Figure 4). Bedrock and Quaternary geology has been systematically recompiled in MaPublisher georegistered Adobe Illustrator files. Once the digital compilation of contacts and structural and resource data was completed, a preliminary digital geologic map was printed and edited, permitting complete conversion of these maps to digital geologic maps.
Contacts in the Prentiss quadrangle were correctly located during geologic mapping, but at least one contact, the Soque River fault (southeastern part of the quadrangle), has been reinterpreted as a fault. This and the fault to the northwest are now known to be tectonostratigraphic terrane boundaries, with three tectonostratigraphic terranes represented here. Compare the digital map (Figure 4) with the Hatcher (1980) version. While the geometry and location of contacts on a properly constructed geologic map should be correct, interpretation of contacts may change through time. In addition to the terranes represented in the Prentiss quadrangle, there are several small massive sulfide deposits, sub-economic sillimanite deposits, and one or more rock units that could serve as sources of dimension stone. The U.S. Forest Service Coweeta Hydrologic Research Laboratory is also located in the Prentiss quadrangle (e.g., Hatcher, 1988; Swank and Crossley, 1988). The detailed geologic map of this quadrangle thus has considerable utility both from an academic and an applied geoscience perspective, as well as use by non-geologists for basic and applied research in forest ecology.
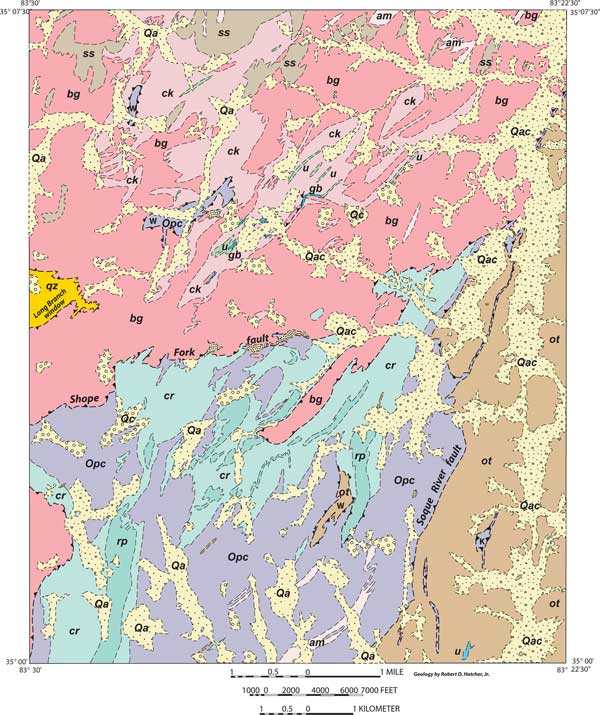
Figure 4. Digital geologic map of the Prentiss 7.5-minute quadrangle, North Carolina (after Hatcher, 1980) [a more legible color version of this figure is available at http://ngmdb.usgs.gov/Info/dmt/docs/hatcher05.html].
The detailed geologic map of the Tugaloo Lake quadrangle (Figure 5) was completed during the 1960s and early 1970s. It preserves a record of major tectonic events ranging from the 1.1 Ga Grenville orogeny, and several Paleozoic orogenies, through Mesozoic extension prior to opening of the Atlantic Ocean, and Tertiary-Quaternary drainage development. The map area is astride the eastern Blue Ridge and western Inner Piedmont geologic provinces in the internal parts of the southern Appalachians, in the Tugaloo tectonostratigraphic terrane (Hatcher, 2002). These provinces are separated by the Brevard fault zone, but several other major structures are also present. In the northwestern part of the geologic map is the southeastern flank of the Tallulah Falls dome, which is rimmed by several 1.15 Ga Grenville basement bodies (Hatcher et al., 2004). The multiply-reactivated Brevard fault zone (e.g., Hatcher, 2001) trends northeast-southwest across the central part of the map. Detailed geologic mapping has revealed that the entire Brevard fault zone is repeated by one or more large faults. In addition, late Brevard faults cut klippens that are remnants of the Alto allochthon in the Six Mile thrust sheet to the southeast (Hopson and Hatcher, 1988) providing critical evidence supporting the reactivation history of the fault zone. All rock units were later crosscut by Jurassic diabase dikes that preclude subsequent movement on the Brevard or other faults in this area. Rock units northwest of the Brevard fault zone contain subcommercial grade quantities of kyanite that have been prospected. Ordovician granitoids suitable for quarrying, and small amounts of sulfide minerals occur in the Poor Mountain Amphibolite southeast of the Brevard fault zone.
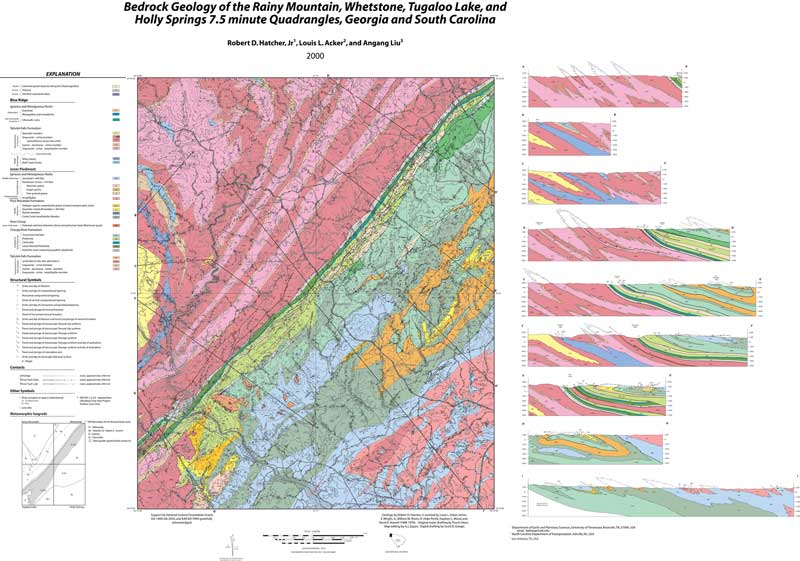
Figure 5. Bedrock geology of the Rainy Mountain, Whetstone, Tugaloo Lake, and Holly Springs 7.5 minute Quadrangles, Georgia and South Carolina (Hatcher, Acker, and Liu, 2000). Mapping assistance between 1968-1976 was provided by Clemson University undergraduates James E. Wright, Jr., William M. Rivers, D. Hoke Petrie, and Stephen L. Wood, and by David E. Howell (SC Geological Survey). Original mylar drafting by Teunis Heyn. Map editing by A.J. Zupan (SC Geological Survey). Digital graphic created at 1:48,000 scale by S.D. Giorgis. This figure shows a reduced-scale version of the map; the full-sized, color map is available at http://ngmdb.usgs.gov/Info/dmt/docs/hatcher05.html.
My graduate students and I have been producing digital 1:12,000 or 1:24,000 scale detailed geologic maps directly from field data since the mid-1990s. This permits daily compilation and revision of geologic maps as they accumulate data toward completion of a detailed geologic map. Scott D. Giorgis (1999) mapped portions of four 7.5-minute quadrangles in the Appalachian Inner Piedmont near Morganton, North Carolina (Figure 6), and recognized a major fault—now considered a tectonostratigraphic terrane boundary, with supporting state-of-the-art geochronologic data. This and subsequent mapping by 10 more graduate students in that area has been supported by the EDMAP component of the USGS-administered National Cooperative Geologic Mapping Program. All produced high quality detailed geologic maps, but the geologic maps completed under this program throughout the United States exhibit a wide range of quality for a variety of reasons. These maps regardless of quality presently have no outlet into the community except for a few that are published or placed into open files by state geological surveys. Many EDMAP geologic maps remain in non-digital format, and many of those judged to be high quality maps should be scanned or converted to digital maps and made available through major databases, e.g., the National Geologic Map Database or GEON, or other outlets.
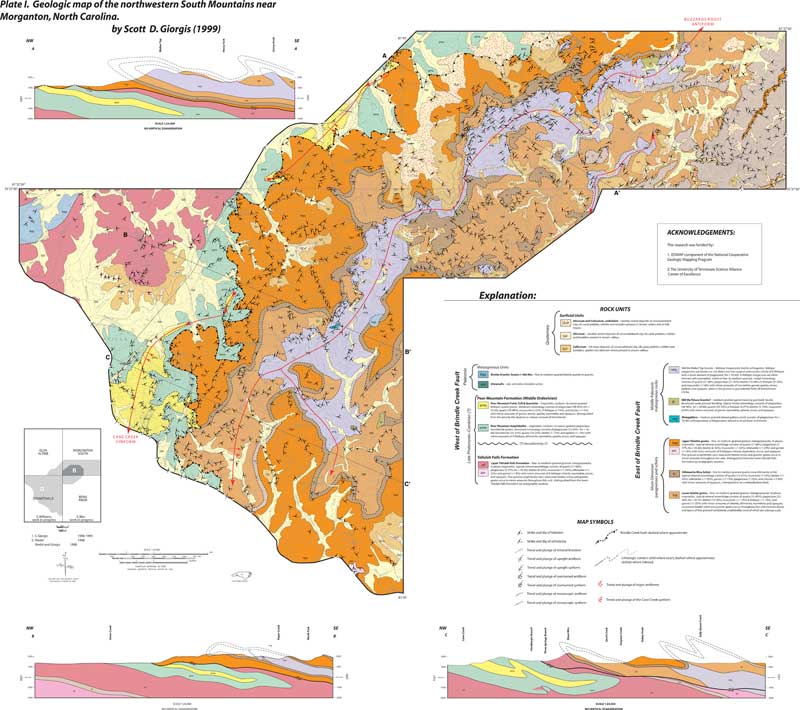
Figure 6. Geologic map of the northwestern South Mountains near Morganton, North Carolina (Plate 1 in Giorgis, 1999). This figure shows a reduced-scale version of the map; the full-sized, color map is available at http://ngmdb.usgs.gov/Info/dmt/docs/hatcher05.html.
An important use of detailed geologic maps is compilation into maps of islands of knowledge, and tying these islands together using reconnaissance geologic mapping into more regional, small-scale maps useful for interpretation of regional geology and tectonic synthesis. Some of these islands consist of maps that have been scanned and redrawn in Adobe Illustrator and composited using MaPublisher into maps of larger areas (Figure 7). These geologic maps become very useful sources of information for compiling tectonic, resource, and other derivative maps (Figure 8).
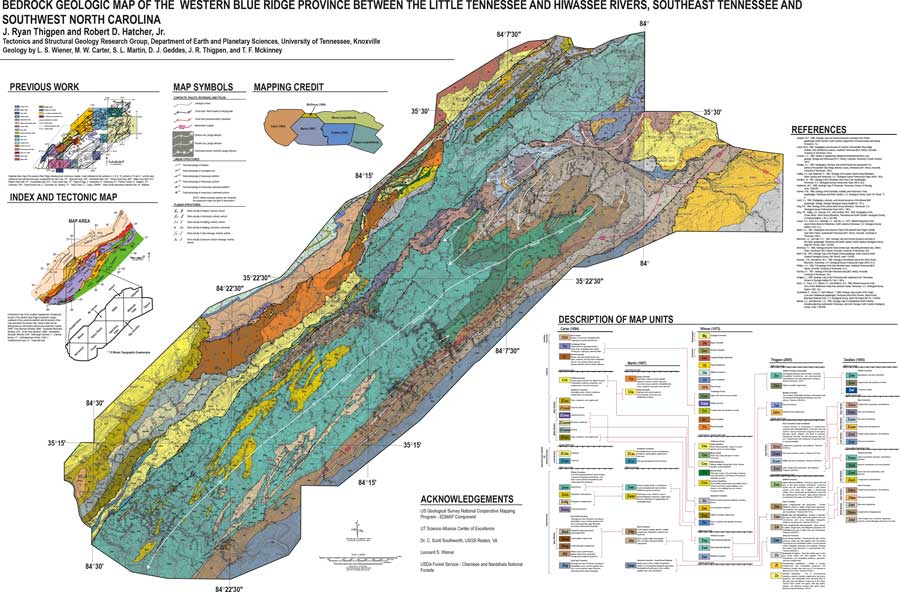
Figure 7. Bedrock geologic map of the western Blue Ridge Province between the Little Tennessee and Hiwassee Rivers, southeast Tennessee and southwest North Carolina (from Thigpen, 2005). Compiled from University of Tennessee theses by Phillips (1952), McKinney (1964), Carter (1994), Geddes (1995), Martin (1997), Whisner (2005), and Thigpen (2005); and Lesure et al. (1977), Merschat and Hale (1983), and Slack et al. (1984). This figure shows a reduced-scale version of the map; the full-sized, color map is available at http://ngmdb.usgs.gov/Info/dmt/docs/hatcher05.html.
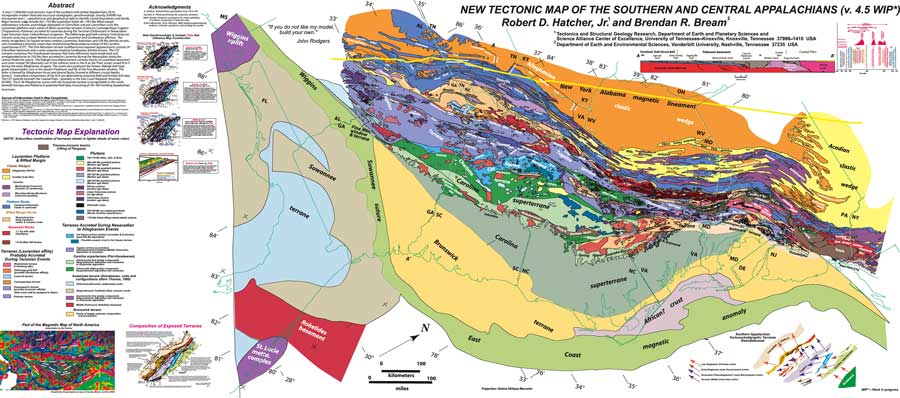
Figure 8. New tectonic map of the southern and central Appalachians (modified from Hatcher and Bream, in preparation, 2006). This figure shows a reduced-scale version of the map; the full-sized, color map is available at http://ngmdb.usgs.gov/Info/dmt/docs/hatcher05.html.
U.S. National Science Foundation grants GA1409, GA20321, EAR810852, EAR8206949, EAR8417894, EAR9004604, and EAR9814800 supported much of the detailed geologic mapping in the Carolinas and northeast Georgia by RDH and graduate students during the 1970s, 1980s, 1990s, and early 2000s. Additional detailed mapping support during the late 1960s and early 1970s was provided by the South Carolina Geological Survey, Henry S. Johnson, Jr., and Norman K. Olson, state geologists. National Science Foundation Grants GA-1409, GA-2032, and EAR 8417894, and the South Carolina Geological Survey, supported the mapping in Figure 5. Detailed geologic mapping in North Carolina, Georgia, and Tennessee during the late 1990s and early 2000s has been supported by grants from the EDMAP component of the National Cooperative Geologic Mapping Program administered by the U.S. Geological Survey, with cooperation from the geological surveys of North Carolina, Tennessee, and Georgia. The University of Tennessee Science Alliance Center of Excellence also has provided considerable support for RDH and students since 1986. Review by David Soller resulted in significant improvement of the manuscript, but I remain culpable for any errors of fact or interpretation.
Ausburn, M.P., Hatcher, R.D., Jr., Bryan, J.G., Godfrey, S.E., and Acker, L.L., 1998, Geologic map and mineral resources summary of the Topton quadrangle, North Carolina: North Carolina Geological Survey, GM 159NW, scale 1:24,000.
Carter, M.W., 1994, Stratigraphy and structure of part of the Blue Ridge Foothills, Polk and Monroe Counties, Tennessee [M.S. thesis]: Knoxville, University of Tennessee, 233 p.
Geddes, D.J., 1995, Stratigraphy, structure, and environmental site assessment of a portion of the western Blue Ridge, Monroe County, Tennessee [M.S. thesis]: Knoxville, University of Tennessee, 195 p.
Giorgis, S.D., 1999, Inner Piedmont geology of the northwestern South Mountains near Morganton, North Carolina [M.S. thesis]: Knoxville, University of Tennessee, 186 p.
Hatcher, R.D., Jr., 1980, Geologic map and mineral resources of the Prentiss quadrangle, North Carolina: North Carolina Geological Survey, GM 167-SW, scale 1:24,000.
Hatcher, R.D., Jr., 1988, Bedrock geology and regional geologic setting of Coweeta Hydrologic Laboratory in the eastern Blue Ridge, with some discussion of Quaternary deposits and structural controls of topography, in Swank, W.T., and Crossley, D.A., Jr., eds., Studies in ecology, Coweeta Symposium Volume 66: New York, SpringerVerlag, p. 8192.
Hatcher, R.D., Jr., 2001, Rheological partitioning during multiple reactivation of the Paleozoic Brevard Fault Zone, Southern Appalachians, USA, in Holdsworth, R.E., Strachan, R.A., Macloughlin, J.F., and Knipe, R.J., eds., The nature and significance of fault zone weakening: Geological Society of London Special Publication 186, p. 255269.
Hatcher, R.D., Jr., 2002, An Inner Piedmont primer, in Hatcher, R.D., Jr., and Bream, B.R., eds., Inner Piedmont tectonics focused mostly on detailed studies in the South Mountains and the southern Brushy Mountains, North Carolina: Carolina Geological Society Guidebook, North Carolina Geological Survey, p. 118.
Hatcher, R.D., Jr., and Acker, L.L., 1984, Geology of the Salem quadrangle, South Carolina: South Carolina Geological Survey, MS26, 23 p., scale 1:24,000.
Hatcher, R.D., Jr., Acker, L.L., and Liu, A., 2000, Bedrock geology of the Rainy Mountain, Whetstone, Tugaloo Lake, and Holly Springs 7.5 minute Quadrangles, Georgia and South Carolina: unpublished map funded by National Science Foundation Grants GA-1409, GA-2032, and EAR 8417894, scale 1:24,000.
Hatcher, R.D., Jr., and Bream, B.R., in preparation 2006, Tectonic map of the southern and central Appalachians: scale 1:1,000,000.
Hatcher, R.D., Jr., Bream, B.R., Miller, C.L., Eckert, J.O., Jr., Fullagar, P.D., and Carrigan, C.W., 2004, Paleozoic Structure of Southern Appalachian Blue Ridge Grenvillian Internal Basement Massifs, in Tollo, R.P., Corriveau, L., McLelland, J., and Bartholomew, M.J., eds., Proterozoic evolution of the Grenville orogen in North America: Boulder, Colorado, Geological Society of America Memoir 197, p. 525547.
Hopson, J.L., and Hatcher, R.D., Jr., 1988, Structural and stratigraphic setting of the Alto allochthon, northeast Georgia: Geological Society of America Bulletin, v. 100, p. 339350.
Lesure, F.G., Force, E.R., Windolph, J.F., and Hill, J.J., 1977, Mineral Resources of the Joyce Kilmer-Slickrock Wilderness, North Carolina-Tennessee: U.S. Geological Survey Bulletin 1416, 41 p.
Martin, S.L., 1997, Stratigraphy and structure of part of the western Blue Ridge foothills near Tellico Plains, southeastern Tennessee [M.S. thesis]: Knoxville, University of Tennessee, 249 p.
Merschat, C.E., and Hale, R.C., 1983, Geologic map and mineral resources summary of the Farner quadrangle, Tennessee and North Carolina: North Carolina Geological Survey Map GM 133-NE, scale 1:24,000.
McKinney, T.F., 1964, Geology along the Great Smoky fault, Groundhog Mountain area, Tellico Plains, Tennessee: [M.S. thesis]: Knoxville, University of Tennessee, 49 p.
Phillips, H.E., 1952, The geology of the Starr Mountain area, southeast Tennessee [M.S. thesis]: Knoxville, University of Tennessee, 61 p.
Slack, J.F., Force, E.R., Behum, P.T., and Williams, B.B., 1984, Mineral resources of the Citico Creek Wilderness study area, Monroe County, Tennessee: U.S. Geological Survey Bulletin 1552, 32 p.
Swank, W.T., and Crossley, D.A., Jr., eds., 1988, Studies in ecology, Coweeta Symposium Volume 66: New York, SpringerVerlag, 469 p.
Thigpen, J.R., 2005, Stratigraphic and structural relationships of the Ocoee Supergroup, southern Appalachians: Implications for Neoproterozoic rift basin architecture and Paleozoic collisional orogenesis [M.S. thesis]: Knoxville, University of Tennessee, 156 p.
Whisner, S.C., 2005, The Middle Ordovician TellicoSevier Syncline: A stratigraphic, structural, and paleoseismic investigation [Ph.D. dissertation]: Knoxville, University of Tennessee, 228 p.
Wilson, C.W., Jr., 1971, Geologic map of the Buffalo Valley quadrangle, Tennessee: Tennessee Division of Geology, GM 322-NE, scale 1:24,000.
Wilson, C.W., Jr., Kirby, J.P., and Miller, R.A., 1964, Geologic map of the Columbia quadrangle, Tennessee: Tennessee Division of Geology, GM 57-SE, scale 1:24,000.

![]() U.S. Department of the Interior |
U.S. Geological Survey
U.S. Department of the Interior |
U.S. Geological Survey
URL: pubsdata.usgs.gov /pubs/of/2005/1428/hatcher/index.html
Page Contact Information: David R. Soller
Page Last Modified: Saturday, 12-Jan-2013 22:04:55 EST
