U.S. Geological Survey Open-File Report 2005-1428
Digital Mapping Techniques '05—Workshop Proceedings
During a 5-year period, the South Carolina Geological Survey mapped 23 7.5-minute quadrangles in the Ashepoo-Combahee-Edisto River (ACE) Basin and Hilton Head areas in South Carolina. This mapping was funded by the U.S. Geological Survey STATEMAP program. The ACE Basin is a rapidly changing coastal ecosystem at the convergence of these three rivers.
Doar and Hudson (2004) stated, "Geology has a major part to play in coastal zone resource and hazard management. Understanding the physical environment of the coastal zone, in particular its geomorphological evolution, is essential for determining a strategy for land use and development that is both sustainable and sensitive to the rich wildlife of the ACE Basin. Geologic information also provides a long-term perspective on coastal zone issues. This perspective is important because it is largely unaffected by tidal or seasonal variability. Mapping provides information on tectonic processes that influence uplift or downwarp in the coastal zone. Such uplift or downwarp determines whether large estuaries will develop along any particular part of the coastline. Defining tectonic processes affecting the coastal zone also is important in understanding relative sea-level change. Sea levels have been rising since glacial ice began to retreat in the northern hemisphere 18,000 years ago. The location and age of depositional units within the coastal zone provide information on how the coastline developed. Integrating such information with offshore data will show how quickly the coastline has changed or can change during periods of rapid sea-level rise.
Accurate base maps provide a basic tool for delineating geomorphic features throughout an area. While developing digital maps, the Geological Survey realized that the USGS topographic quadrangles, originally used by field geologists to delineate geologic contacts, were outdated. In some cases they were more than 40 years old. The dynamic nature of this coastal environment and the availability of current aerial imagery led to the conclusion that a much better geologic data set for the area could be created.
The geologist's field maps are drawn on a 7.5-minute topographic base. Finished maps are scanned at 200-300 dpi, depending on the complexity of the map, and saved as a TIFF image. The TIFF is then opened in R2V (raster to vector software), and control points are selected. Most often the four corners of a 7.5-minute quadrangle are suitable control points. The hydrography DLG is imported into the project, the geologic contact lines are digitized, and these two are edited together. A line shapefile of the combination is exported. The bounding edge of the quadrangle is not included in the editing procedure in R2V, because the quadrangle border can inadvertently be pulled or snapped away from its correct position. The quadrangle boundary is merged with the geologic-contact line file in ArcMap, using the geoprocessing tool. The result is a new line shapefile containing all base and geologic lines.
In ArcCatalog, a personal geodatabase is created for the mapping area. A feature dataset is created by importing the digitized polyline shapefiles as feature classes. Topology rules are assigned in order to validate the topology of the new line-feature classes. Examples of line rules include: must be single part, must not intersect, and must not have dangles. A first-pass validation of these topology rules is performed in order to edit all the geology and hydrography lines that intersect the quadrangle boundary, and to snap them accordingly.
In ArcMap, the entire quadrangle is edited to ensure that all of the topology rules for lines are followed. After the lines are validated, they are coded for type and position. In lower Coastal Plain maps, the lines are coded as geologic contacts or water boundaries. In the Piedmont and upper Coastal Plain of South Carolina, the line coding process is more involved. In most map projects, once the lines are coded, a new empty-polygon feature class is brought in and features are constructed with the topology toolbar, which builds the polygon file.
At this point, the accuracy and precision of geologic contacts is evaluated. Because the coastal environment is constantly changing and the topographic base maps are typically 20 to 30 years old, there are significant changes to the base map that affect contact-line accuracy. These changes can be natural or manmade. Natural changes are common on the active beach front through the addition and subtraction of deposits. Manmade changes are brought about by the intense development this area has experienced over the last 20 years. According to a recent U.S. Census Bureau report, Beaufort County had an estimated population growth rate of 11.2 percent for the years 2000-2004. The State average for the same period was about 4.3 percent.
During the ACE Basin geologic mapping project, available aerial photography was used to improve the accuracy of the geologic information delineated by the geologist on field maps. Interpretation of aerial photos was used to more precisely delimit geological features in the study area. Photos were loaded into the ArcMap project, and edits were made with the editing, snapping, and topology tools. The precision and smoothness of lines were corrected up to a scale of 1:5000. Items most often corrected included: moved earth or artificial fill; water bodies; islands; and salt-marsh features. This area has a large amount of new development, such as golf courses, residential areas, and roadways that has altered the geologic landscape. Even the most recent air photos (2-3 years old) can be out of date for some areas.
Edge matching adjacent quadrangles was also a priority. Usually the cartographer completed the editing process. When the geologic contacts were not clear a marker was placed, and the geologist would carefully review and describe what edits needed to be made in order to ensure edge matching. The examples shown as Figures 1, 2, and 3 are common types of edits that were made.
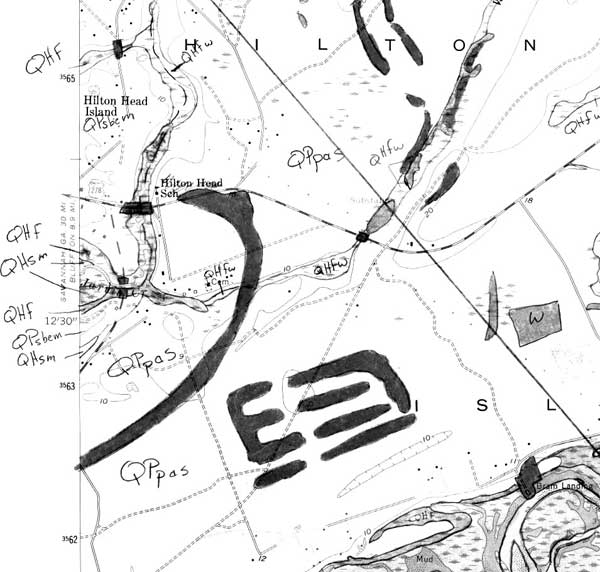
Figure 1. The geologists field map, drafted onto a USGS topographic quadrangle base. This map is then scanned and digitized.
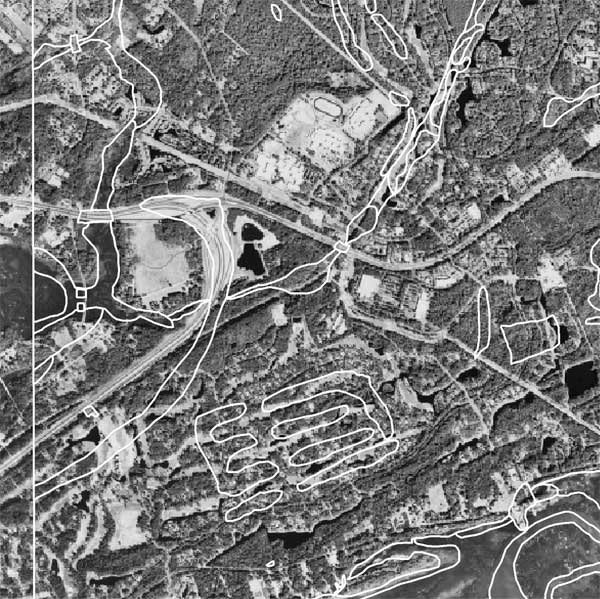
Figure 2. Geologic contact lines digitized from the field map, before corrections were made.
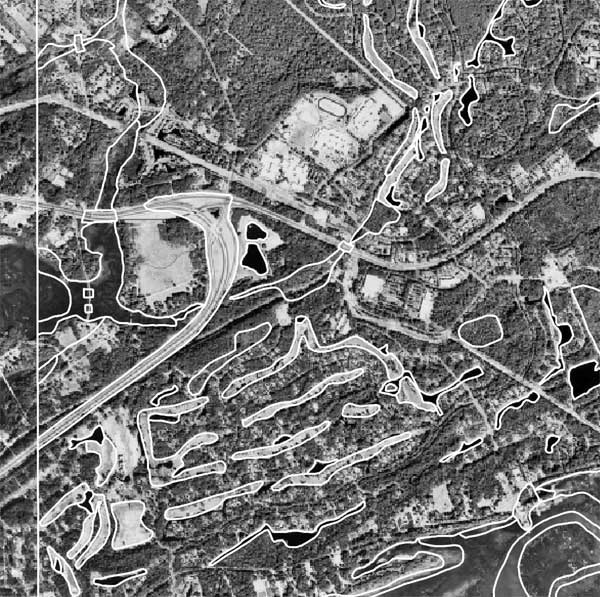
Figure 3. Geologic contact lines after corrections were made by using available aerial photography. In this example, dramatic changes were made to a large area of moved earth created by a road interchange on Hilton Head Island. In addition, locations of water bodies and golf-course fairways (moved earth) were significantly altered from the original field map. All of the digitizing and aerial photography interpretation was done by a cartographer and later reviewed and accepted by the project geologist.
After corrections are made to each quadrangle, a final validation is performed. At this point, an empty polygon feature class is brought in, all lines in the quadrangle are selected, and polygon features are constructed with the topology toolbar. Then the polygons are coded and attributes are assigned. In the ACE Basin and Hilton Head areas there are 40 geologic units across 7 terraces.
Portraying accurate cross sections digitally has been a challenge for the digital-mapping group. Often, the final cross sections do not accurately match the map units or ground distances. Additional hours of corrections, or even construction of a new cross section, were often the only answer. Accordingly, some aspects of the process have been adjusted. Most importantly, the construction of a digital cross section is delayed until the digital map layers are completely edited. Using the following procedure has greatly reduced errors.
Final cartography is accomplished by using Adobe Illustrator software with a map production plug-in (MAPublisher 6). The plug-in imports geographically referenced data into a graphics environment. An import tool, along with style sheets and symbol sets, allows map products to be easily updated. Templates are used for most of the non-map features of the layout, thus saving more time.
The South Carolina Geological Survey, upon completion of this digital compilation and metadata, intends to release the geology layers through the South Carolina Department of Natural Resources, GIS Clearinghouse. Geographic data in the Clearinghouse are organized in 7.5-minute quadrangles. This 23-quadrangle compilation represents the first set of digital data layers made available by the South Carolina Geological Survey.
W. R. Doar, III (SCGS geologist) mapped the ACE Basin and Hilton Head areas, assisted by drillers Joe Koch and Gary Taylor. Malynn Drescher assisted with the poster design.
R2V Able Software, http://www.ablesw.com
ArcGIS ESRI, http://www.esri.com/
Adobe Illustrator Adobe Systems, http://www.adobe.com
MaPublisher Avenza, http://www.avenza.com
Doar, W.R., III, and Hudson, E.E., 2004, Geology of the ACE Basin, Beaufort, Charleston, and Colleton Counties, South Carolina: South Carolina Geological Survey Open-File Poster 150, 1:62500, accessed at http://www.dnr.state.sc.us/geology/publications.htm#ofp.

![]() U.S. Department of the Interior |
U.S. Geological Survey
U.S. Department of the Interior |
U.S. Geological Survey
URL: pubsdata.usgs.gov /pubs/of/2005/1428/hudson/index.html
Page Contact Information: David R. Soller
Page Last Modified: Saturday, 12-Jan-2013 22:04:58 EST
