U.S. Geological Survey Open-File Report 2005-1428
Digital Mapping Techniques '05—Workshop Proceedings
The detail afforded by LIDAR imagery gives striking views of surface features previously known much more poorly or not at all. For some previously known features such as the traces of active faults in the south Louisiana coastal plain, LIDAR permits mapping with much greater accuracy and detail than previously was possible. Nevertheless, experience with newly available LIDAR imagery in Louisiana suggests that not all of the aspects resolved by the improved detail are meaningful in the context of mapping surface geology. For example, a physiographic character dominated by an abundance of fine-scale surface relief may obscure gross-scale characteristics diagnostic of the units composing the mapping schema of a project, i.e., the units that a given mapping exercise is intended to delineate. Abundant detail may also create suggestions of subdivisions of primary map units that are not borne out by observation. Even where the detail resolves surface aspects considered geologically meaningful, fitting LIDAR-based interpretations of them to a suitable base map in some areas remains a practical problem for the near-term future, because topography compiled by non-photogrammetric means on some older base maps cannot be matched to such detail. When custom production of user-designed large-scale topographic base maps from the same LIDAR DEMs becomes cost-effective and routine, use of LIDAR imagery in geologic-mapping applications likely also will become commonplace; until then, such use probably will remain selective, though LIDAR imagery should continue to be a medium of discovery, and a tool for revision and amplification of map interpretations within the constraints of existing map editions.
Between late 1999 and early 2000, a program was begun to generate LIDAR data coverage for the state of Louisiana, the funding source being the Louisiana Federal Emergency Management Agency and the U.S. Army Corps of Engineers, St. Louis District. At this time, coverage is primarily restricted to south Louisiana, with limited portions of north Louisiana (Rapides, Ouachita, and Lincoln parishes) having received coverage in recent years. This paper summarizes impressions regarding the use of LIDAR imagery in geologic-mapping applications during the first several years of its availability in Louisiana, by an author having no previous exposure to it. As such, the views expressed herein reflect a limited baseline of experience. All the LIDAR digital elevation models (DEMs) figured herein were generated by the program mentioned above and obtained as downloads from the Atlas website (http://atlas.lsu.edu/), and all the views of DEMs in these figures were created with Global Mapper DEM viewer.
Existing 7.5-minute topographic quadrangles in south Louisiana use a 5-ft (1.5-m) contour interval, whereas the LIDAR datasets generated by the above program exceed this vertical precision by greater than an order of magnitude, with an effective vertical resolution of approximately 0.03 m (0.1 ft) following correction for vegetation1 (the instrumental vertical resolution is reported to be 0.003 m (0.01 ft) at a horizontal grid spacing of 5 m). This increased detail (Figure 1) enables the imaging of features previously perceived only dimly or not at all. Some features previously known appear stunningly and unambiguously imaged with LIDAR data, especially active surface faults in the south Louisiana coastal plain, the traces of which appear with unprecedented clarity. One issue preventing the immediate wholesale use of LIDAR imagery for large-scale geologic-mapping applications, however, is that in many areas the conflicts between the existing large-scale USGS base map and the LIDAR-derived feature renderings are nontrivial and intractable, and as a result standard large-scale topographic base maps on which new LIDAR-based interpretations may be properly georeferenced are not available for these areas. This is especially the case with quadrangle sheets for which topography was compiled by nonphotogrammetric means.
1Effective vertical resolution assessed by 3001, Inc. (New Orleans), which flew the LIDAR.
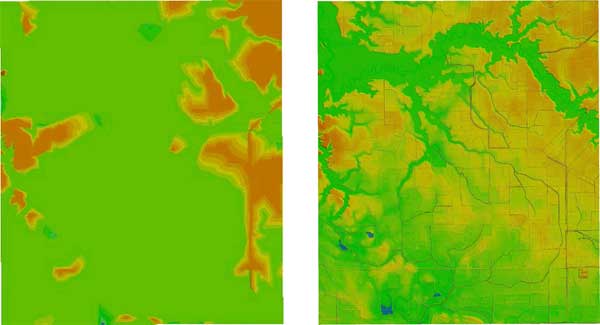
Figure 1. Example of improved detail afforded by LIDAR DEMs (right) over standard 7.5-minute quadrangle DEMs (left) in a generally low-relief area (Gueydan quadrangle, southwestern Louisiana). Colored shaded-relief views of digital elevation models in this and subsequent figures were downloaded from the Atlas website (http://atlas.lsu.edu/) and viewed with Global Mapper DEM viewer. LIDAR data source: Louisiana Federal Emergency Management Agency, and U.S. Army Corps of Engineers, St. Louis District.
1. Artifacts (artificial differences in perception of the same DEM in this case) may result from (1) choice of a particular shader option, because of varying degrees of differentiation of the vertical color scale by different shaders; (2) change of the elevation scale range and elevation color contrast associated with an area of interest, after mosaicking an image of the area into a composite image of a larger area (with shader options that employ a uniform color spectrum over the entire vertical scale applicable to an image); and (3) the random association of particular elevation values with particular hues as a result of these choices. (This is somewhat analogous to the differences one can obtain in contour maps of the same landscape by selecting slightly different contour intervals, or by selecting the exact same contour interval but using different datums that are not whole-number multiples of it.) Such accidental associations and results may affect user perception in nontrivial ways (Figure 2).
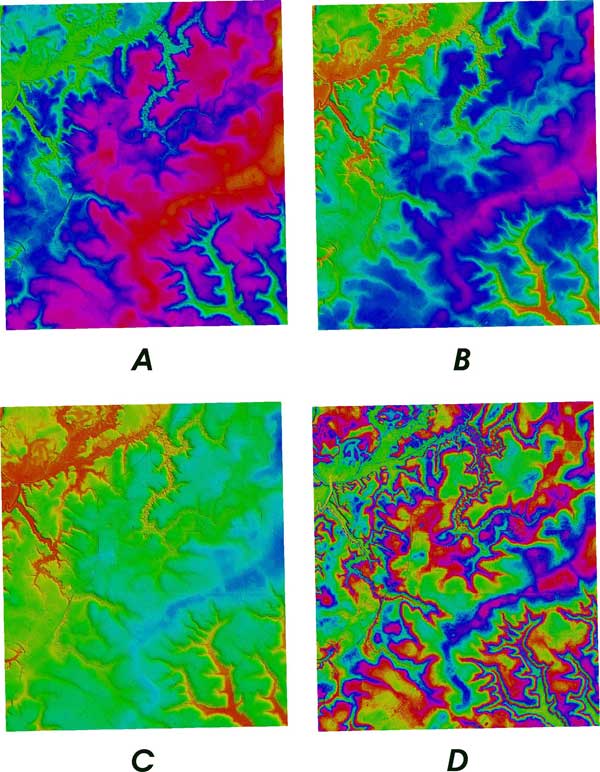
Figure 2. Artificial differences in appearance created using different shader options for the same LIDAR DEM of an area: A and B represent different starting colors, C and D represent different color ranges (northeast quarter of French Settlement quadrangle, southeastern Louisiana).
One way to decrease the influence of such artifacts on viewer perception generally is to create several DEM views, each with a different shader option. Effect (2) listed above can be eliminated by viewing the DEM of both the single image and the mosaicked composite image with at least one shader that assigns unique hues to particular elevation values in a series that repeats itself rather than covering the entire elevation range for the image area with a single color spectrum.
2. Preparation of an interpretive map using any new technique is an iterative process that begins with a period of orientation involving the calibration of sense perceptions to cues considered meaningful or found to be so by the mapper. Following this initial adaptation the mapper conducts ongoing tests of these cues while employing them as recognition criteria to organize the growing body of perceptions into a conceptual framework. Greater experience leads to more effective focus on what is judged to be essential.
In Louisiana, the advent of LIDAR coverage has implications both for the recognition of map units against a field of abundant surface detail largely undiagnostic of them, and for the potential suggestion of phantom subunits by such detail. Fine surface detail may mask the gross geomorphic signature of the units of surface geology that the mapper considers it meaningful to distinguish, e.g., a dramatic increase in dissection and relief across a drainage divide associated with proximity to a river or major stream may obscure a contact between two mappable bedrock geologic units in the same area. In south Louisiana the opposite problem more likely occurs, in that land surface relief on the coastal plain may, if rendered in fine detail, generate what appear to be potential contacts within the outcrop belts of the units being mapped (Figure 3). Upon examination, however, these putative contacts typically do not correlate readily with recognizable subdivisions of the primary map units; as a result, careful evaluation of every such suggestion by means of other criteria is essential.
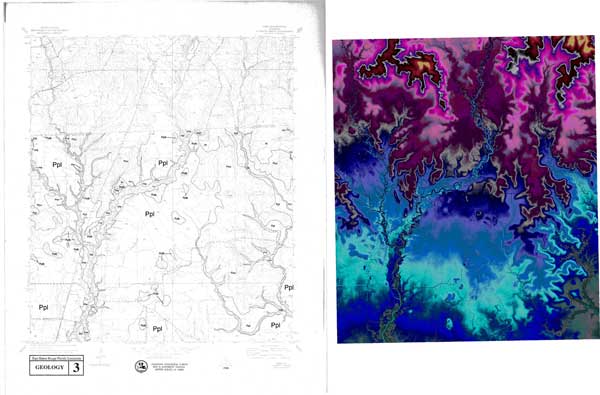
Figure 3. Putative subunits of a geologic map unit suggested by the detail on a LIDAR DEM (Fred quadrangle, north-central south Louisiana). In this case the large Ppl polygon in the southern portion of the quadrangle (geologic mapPlate 3 of Autin and McCulloh 1991, left) belongs to a unit the surface of which is tilted to form a ramp, and in this view of the LIDAR DEM (right) the unit appears potentially subdivisible because of the particular suite of shader attributes chosen. (Geology is mapped only in that portion of the quadrangle lying in East Baton Rouge Parish.)
3. The land surface of Louisiana shows a perceptible, albeit intermittent, rectilinearity of its drainage courses, which is suggestive of control by systematic fractures (McCulloh, 1995 and 2003). Older topographic maps compiled nonphotogrammetrically at scales of 1:62,500 and larger may miss this character completely where it occurs at smaller dimensions in smaller areas. An example is shown from the Fred 7.5-minute quadrangle (Figure 4): the headward area of one drainage system shows a strikingly rectilinear pattern on the LIDAR DEM, whereas the non-photogrammetrically compiled topographic base gives little or no suggestion of this. This aspect (as the distribution of interpreted alluvium) cannot be rendered on a map of surface geology fitted to the existing base, and no alternative base is likely to become available for some time unless custom production of user-designed base maps becomes cost-effective and routine.
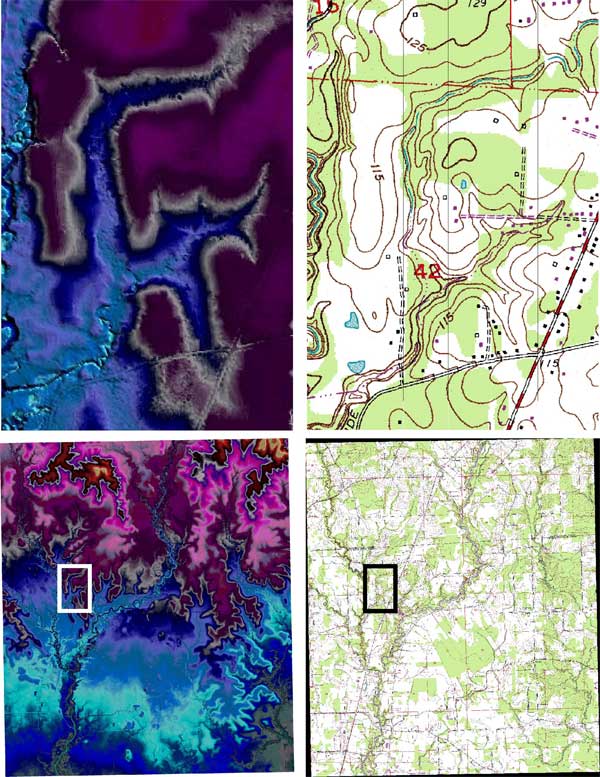
Figure 4. Rectilinear aspect of the headward portion of a drainage shown by LIDAR (left) is much less obvious on the 7.5-minute topographic quadrangle (right), which was non-photogrammetrically compiled (Fred quadrangle, north-central south Louisiana: LIDAR quarter-quadrangle mosaic, lower left, and enlargement of inset area, upper left; USGS 7.5-minute topographic quadrangle, lower right, and enlargement of same inset area, upper right).
4. Rapid change of surface detail in an area also generates conflict with existing base maps, making them obsolete regardless of how they were compiled. In Louisiana, this is especially characteristic of areas experiencing changes in the position of the land-water interface, such as rapidly eroding and accreting banks within flood plains and along estuaries of the major rivers, and shorelines subject to high rates of coastal erosion and land loss. In such areas, images of the DEM generated from recently flown LIDAR data will be in conflict with existing base maps regarding areas corresponding to land and open water (Figure 5). Such change may be largely unrelated to contacts between mapped geologic units; if the surface-geology layer incorporates substantial LIDAR-based interpretations, however, fitting it to a suitable 7.5-minute base map will then require either custom creation of a new base from the same LIDAR DEM or revision of the existing base involving substantial adjustment in places.
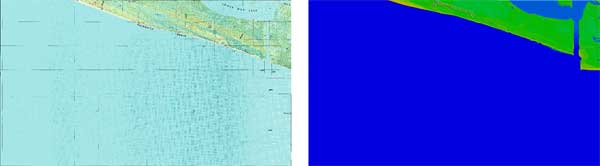
Figure 5. LIDAR DEM (right) depicting shoreline substantially changed from that depicted on the 7.5-minute topographic quadrangle (DRG, leftHackberry Beach quadrangle, southwestern Louisiana).
The authors experience in Louisiana thus far suggests that for the present, LIDAR imagery is (1) a medium of discovery, revealing hitherto unknown surface features with topographic expression but of such slight relief that elevation contours on standard topographic maps previously had failed to resolve them adequately; and (2) a tool for the modification and/or refinement of previous interpretations (e.g., of active faults displacing surface Quaternary strata) within the constraints of existing editions of topographic and geologic maps. Until it becomes feasible to rapidly prepare custom topographic base maps on suitable media using elevation contours generated from LIDAR DEMs, depiction on published geologic maps of certain LIDAR-based interpretations (those of an intricate nature and/or requiring fitting to the drainage courses of the hydrographic layer) is likely to remain limited.
Although LIDAR-based imagery provides views of the ground surface with unprecedented detail, only some of this detail reflects aspects likely to prove meaningful in the context of most surface-geologic mapping projects. In places, such surface detail may in practice obscure the comparatively gross-scale characteristics considered to have some diagnostic value for the units being mapped. Even where detail provided by LIDAR imagery is found useful in the context of mapping, fitting of more intricate and/or complicated LIDAR-based interpretations of surface geology to suitable large-scale base maps will remain a basic problem for the near-term future, until it becomes feasible for users to rapidly generate new topographic base maps based on LIDAR DEMs. For now, LIDAR imagery is a medium enabling discovery of previously unknown surface features, and a tool for updating map interpretations within the constraints imposed by existing map editions.
Paul V. Heinrich (Louisiana Geological Survey) informed the author of the example of shoreline change shown in Figure 5. David R. Soller (USGS) reviewed and edited the manuscript.
Autin, W.J., and McCulloh, R.P., 1991, Geologic and derivative engineering geology hazard maps of East Baton Rouge Parish, Louisiana: Louisiana Geological Survey Open-File Series no. 9101, prepared for East Baton Rouge Parish Department of Public Works under project no. 90-MS-CP-0024, 31 plates plus index and explanation.
McCulloh, R.P.,1995, Fisks NE- and NW-striking faults and the potential for joint control of stream courses in Louisiana: Gulf Coast Association of Geological Societies Transactions, v. 45, p. 415422.
McCulloh, R.P., 2003, The stream net as an indicator of cryptic systematic fracturing in Louisiana: Southeastern Geology, v. 42, no. 1, p. 117.

![]() U.S. Department of the Interior |
U.S. Geological Survey
U.S. Department of the Interior |
U.S. Geological Survey
URL: pubsdata.usgs.gov /pubs/of/2005/1428/mcculloh/index.html
Page Contact Information: David R. Soller
Page Last Modified: Saturday, 12-Jan-2013 22:05:02 EST
