U.S. Geological Survey Open-File Report 2005-1428
Digital Mapping Techniques '05—Workshop Proceedings
A comprehensive database of glacier extents for the western United States is being compiled in order to document glacier change over the period of the 20th century. Sources for the database include printed historical maps, aerial and oblique photographs, digital data from USGS 1:24000-series topographic maps, and satellite data from NASA. Included in the online interactive database will be scanned versions of all primary source maps. The URL for this project is http://glaciers.us
Our motivations for this study range from applied science to testing new remote sensing image-processing techniques. For example, we are seeking to understand the hydrologic inputs that glaciers provide during the dry months of the summer. We postulate and hope to quantify the extent to which glaciers provide a buffer to the hydrologic system during the nearly rain-free months of August and September. It should also be possible to estimate the increased amount of runoff that has been available to the fi sh-bearing streams over the last century as glaciers have receded and given up their water more rapidly during these hot, dry months.
If we are correct and glaciers are shown to be a signifi cant source of late summer water to the wests streams, this will be important information for local planners in terms of water budgets. We anticipate showing that glacier input affects both the quantity and the temperature of stream water, with concomitant effects on viability of streams for fi sh habitat.
Another motivation and product expected from this work is simply a full inventory of where perennial ice is, or has been, located in the western U.S. We will also include paleo-glaciers as documented by moraines.
We hope this database will provide "ground-truthing" for climate modelers. As a fi rst attempt at this, we have had students use the database in conjunction with precipitation, temperature, and elevation data to perform logistic regression. This should predict the presence or absence of glaciers based on these physical parameters. So far, results have been mixed for various physiographic areas. For example, Washington's regression analysis had reasonable results, whereas Montana's did not. This leads us to look for other factors to include in the regression analysis.
Based on this teams experience in compiling similar databases for the Northern Cascades and several stratovolcanoes in the Pacifi c Northwest, we expect to fi nd three timeslices for each mapped area. Usually there will be available some early historical data such as old photographs and/ or maps from the early 20th century. The second time slice of data will be from the USGS 1: 24,000-series topographic mapping effort of the 1950s and 60s. The third data set will be satellite data from the 1970s and later, collected by NASA and the EROS data center. These will primarily be ASTER, 15m panchromatic images.
The primary data set that ties all other data together is the 1:24,000-scale topographic series. In order to assemble these data, we initially queried the USGS hydrographic data, but unfortunately the data compilation is quite incomplete. Next we turned to the U.S. Forest Service (USFS) and were given a digital set of GIS data of glacier outlines that had been digitized from 1:24,000- scale USGS maps. These data ended up being the starting point for our compilation. The National Park Service (NPS) has been a reliable source for many data sets, and luckily many glaciated regions occur within parks. Historical maps and photos are available from many sources, including local hiking and climbing clubs.
For completing the coverage of glaciers found on USGS topographic maps we overlaid the lines received from the USFS on either Digital Raster Graphics from the USGS or a similar data product from the USFS know as PBS (Portable Base Series). We then checked each line against the reference map to verify that it was indeed a glacier. In some cases, the lines were actually lakes, whereas in other cases they were moraines. In the former case we deleted the lines, while in the latter we saved them for a future study of rock-covered glaciers. Whenever we encountered glaciers on the map sheet that were not depicted by lines within the database we manually digitized them. By hand-scanning the maps at a scale of 1:12,000 we were able to ensure ourselves that we were not missing any glaciers, and that all lines were actually representing perennial ice features.
After compiling these data as a set of lines, we ran a "lines to polygons" conversion with a tolerance set to weed out densely-distributed points created by over-zealous digitizers. We met USGS National Map Accuracy standards for 1:24,000-scale dataone vertex for every 1.7 meters on the ground. In cases where the area near polygon closures did not have suffi cient vertices to meet the standard, we were required to digitize more vertices.
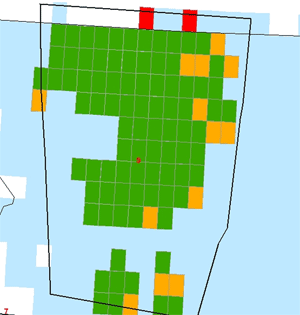
A variety of problems could be expected in any large scale undertaking such as this, and we encountered our share. To begin with, the incomplete coverage of quad maps from any central source required us to seek basemaps from many sources, including state agencies, BLM, USFS, and USGS (Figure 1).
Not uncommonly, lines ended at quadrangle boundaries although the features actually spanned quadrangles. Also, in some cases the lines did not match across quadrangle boundaries. As already noted, there were glaciers missing from the source data sets that needed to be digitized, incorrectly coded lines, and donut polygons and shifted polygons (Figure 2).
Additionally we have encountered the problem of determining which dated set of photos were used to digitize the glaciers depicted on a map. For example, many maps have an initial date of photo acquisition with additional dates of update. In many cases, the glacial features have not been updated at the same time as the cultural features. In most cases we must assume that the earliest date of photographic acquisition is the same date for the glaciers shown on the map.
 |
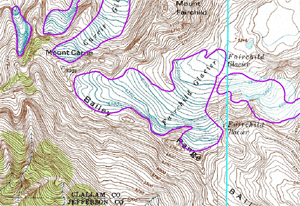 |
Figure 1. Coverage of quads in the North Cascades, WA. Different colors represent different agency sources (USGS, USFS); yellow (or light gray) quads are USGS, green (or medium gray) quads are USFS, red (or dark gray) quads are not available and blue (or pale gray) quads are not needed for this study. |
Figure 2. Offset glacier in the Olympic Range. Note that four polygons are in place but one, near the eastern edge, is offset to the west (to left in figure). |
A conceptual problem encountered is that of identifying a glacier through time. It would be a phenomenal task to go through and individually manage in the database each glacier as it changes over time. This would require assigning every glacier object a unique identifi cation and then relating each change in size back to that object. This is particularly problematic in a GIS sense, as a glacier breaks into smaller ice patches. We have chosen to solve this problem by managing the glaciers at the watershed level. Since this project was funded as a hydrology issue, this is consistent with our charter. Thus we sum all glacier volumes in the watershed, and then calculate the volume changes in the watershed over time.
We can proudly announce that after one year of this study, all glaciers found on 1:24000-scale maps have been digitized. There are still issues related to attributes for the individual glaciers, such as the above-mentioned photo date. We also struggle with generating accurate zonal data from the underlying elevation data such as slope and aspect.
Many historical time-slices are available from various agencies and clubs, and digitizing is in progress. In addition, various data sets have been acquired from the various Parks Service agencies. These need to be converted to our data format, in some cases this means converting terminus positions to polygons.
An assets database that links the actual glacier timeslices to the underlying photographic, map or satellite data is under development. In this system the user will be able to click on an individual glacier outline and see the sources that were used for determining the outlines of the glaciers.
We are indebted to our hard-working team of graduate student research assistants for their efforts on this project. These include: Chad Delaney, Amy Ebnet, Hassan Basagic, Matt Hoffman, Keith Jackson, Thomas Nylen, Peter Sniffen, Frank Granshaw, and Jon Ebnet. See the "About Us" page at http://glaciers.us for more information. The various public agencies have also been a joy to work with, and fi nally we acknowledge the funding from NASA and NSF to pay for many parts of this work.

![]() U.S. Department of the Interior |
U.S. Geological Survey
U.S. Department of the Interior |
U.S. Geological Survey
URL: pubsdata.usgs.gov /pubs/of/2005/1428/percy/index.html
Page Contact Information: David R. Soller
Page Last Modified: Saturday, 12-Jan-2013 22:05:08 EST
