U.S. Geological Survey Open-File Report 2005-1428
Digital Mapping Techniques '05—Workshop Proceedings
With the completion of the digital conversion of all of its 1:24,000-scale geologic maps, the Kentucky Geological Survey is developing a Web site that will allow users to create a highly customized geologic map for any project area in the state and then view related information, including well information, geotechnical and hazards data, related publications, photographs, illustrations, and a variety of other descriptions about Kentucky geology. A prototype was released to the public in April 2005 to demonstrate its capabilities and to solicit public comment. Because Kentucky has been completely mapped at a scale of 1:24,000, a detailed geologic map can be made for any area without concern about mismatches along map borders, or missing information. The process of converting these maps to digital format included edgematching of adjoining maps to minimize discontinuities at the edges of quadrangles (Anderson and others, 1997). All of the map data will be stored in a seamless spatial database so that rendering of map units is uniform in all locations. The online geologic map system is integrated with another Web service—the KGSGeoPortal—to facilitate locating the user's area of interest and linking to other useful data sources.
The original objective of this initiative was simply to make data from existing geologic maps available in an online system. In the early stages of development though, it became clear that users desired much more. They wanted to see other related data in the context of the geologic maps. For example, land-use planners needed to view sinkhole locations or landslide potential in the context of the geologic base. Coal companies were interested in viewing mapped coal beds and related site measurements and sample locations. It was also evident that users of this online mapping system would have diverse geologic backgrounds and differ in how they use geologic maps. The system needed to be flexible for this diverse audience, and easy to use. In order to address these challenges, the service was implemented as a customized ArcIMS application using the ActiveX connector with ASP technology.
It was also thought that most users of the system would be looking for information about a specific geographic area—a project area, a property, or a state park, for example. The system should allow the user to quickly find the area of interest, then provide the necessary map information and the ability to print it or save it for future use. Finding specific geographic areas on regional maps provided through the internet has always been a challenge, and adding full-featured search capability to a service also adds complexity. Because of this, KGS developed a separate geographic search function, called the KGSGeoPortal, that can be used to link to a variety of Kentucky data sources, including the new geologic map service described in this paper.
The KGSGeoPortal (http://kgsmap.uky.edu/website/KGSGeoPortal/KGSGeoPortal.asp) has two functions. The first is to allow users to search for common Kentucky geographic names and then view a map that encompasses the extent of the chosen geographic feature. Although many geographic search functions use a central coordinate as a proxy for the location of geographic features, KGS developed a database of Kentucky geography that stores the minimum and maximum coordinate extents for features. Because each extent is a custom area that fully encompasses the geographic feature, the initial map zoom should represent the users area of interest more accurately than centroid-based systems, saving the user further map zooms. A wide variety of standard geographic feature types are presently available (see pull down menu in Figure 1), and nonstandard areas, such as a research project area, can be added. Once the initial extent is reached, the map can be adjusted with standard zoom and pan controls to refine the area of interest.
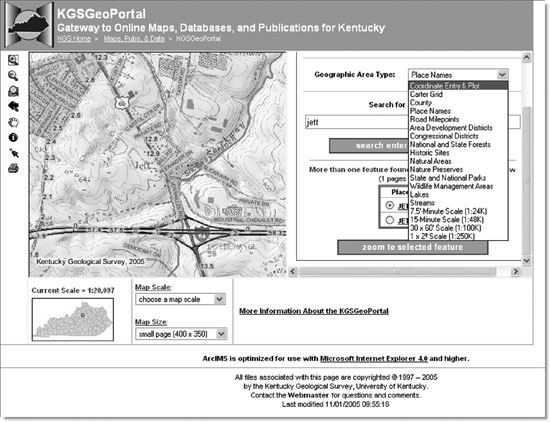
Figure 1. Upper part of KGSGeoPortal site showing map and geographic search types.
The second function of the portal is to link users to other Web data sources using the map's coordinate bounds as search criteria. Any Web service that accepts a URL with coordinates as arguments can be linked. The linked services open in another window, with the same coordinate extent as the portal. Tabular databases, such as wells or sample locations, can also be queried with sql-based language. A table of links to 30 maps and databases for Kentucky are presently provided on the KGSGeoPortal (Figure 2). In the same way that this service can link to other data sources, those sites can link back to the portal to take advantage of its features. For example, the U.S. Geological Survey's National Geologic Map Database's Map Catalog Product Description Pages for Kentucky maps contain a back-link to the portal so that users can view other data for the same area as that of the published map (e.g., http://ngmdb.usgs.gov/Prodesc/proddesc_52383.htm).
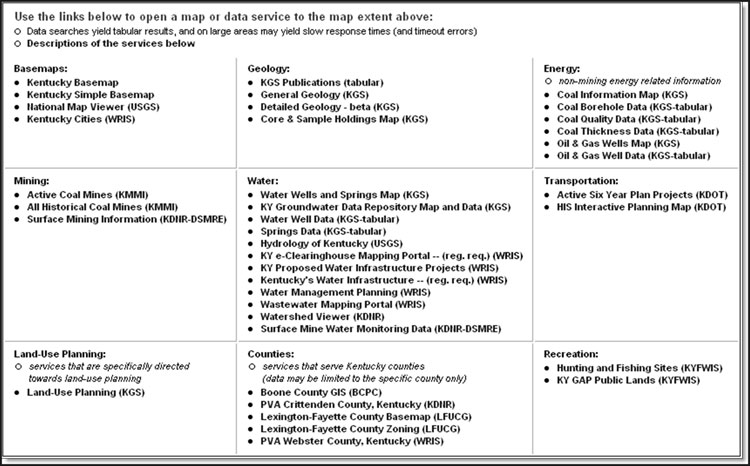
Figure 2. Lower part of KGSGeoPortal site showing available data sources for Kentucky.
Although the KGSGeoPortal provides efficient geographic searching and the ability to compare a variety of data derived from the internet for the same area, it does not have the capability to overlay those data in a single map view. For this reason, the geologic map service was designed to allow that functionality, with an interface that is simple and intuitive to use.
The design of the geologic map service is shown in Figure 3. The Web page http://kgsmap.uky.edu/website/KGSGeology/viewer.asp is divided into three frames. The map frame with standard navigation tools is in the upper left. It is set to a fixed pixel dimension, but can be resized to fit other standard dimensions using the "Map Size" control in the lower frame. Setting the map frame to "full page," for example, results in map dimensions that print exactly on 8.5 by 11 inch paper. The map can also be set to an exact scale by selecting from the "Map Scale" pull down menu in the lower frame. The right hand frame serves three separate functions indicated by the links at the top of the frame: a map legend (the active function on Figure 2), layer control, and a geologic information page. Each function is selected by clicking its link at the top of the frame.
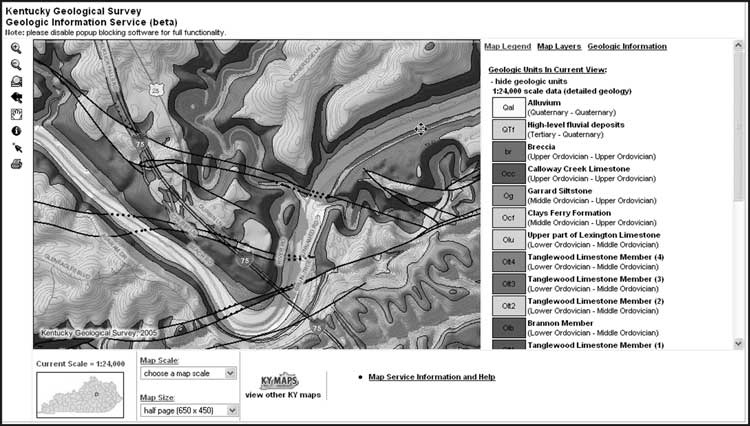
Figure 3. A map display from the KGS geologic map information Web site.
The "Map Layers" tab on the right frame (Figure 4) provides the function of adding or removing thematic and base layers from the view. Because geologic map information can be used for a wide variety of applications, many different styles of maps can be created. All available themes are found under the "Customize" heading. They are grouped according to function: base maps, geology, imagery, derivative classifications, etc. The standard base map is a hillshade topographic image. Selected, or "active" geologic unit themes can be draped over this base to simulate a three-dimensional effect and are in turn overlain by vector elevation contours (see Figure 3). Derivative classifications of the geologic units, such as karst potential or primary lithology, are available as an alternative to standard stratigraphic symbolization. This is accomplished by constructing tables that translate the geologic units to other symbols according to a set of rules determined by KGS geologists. Most themes have assigned scale dependency to prevent rendering them at inappropriate scales. Theme names that are not visible at a given scale are shown in gray type, but can still be selected for inclusion in the layout.
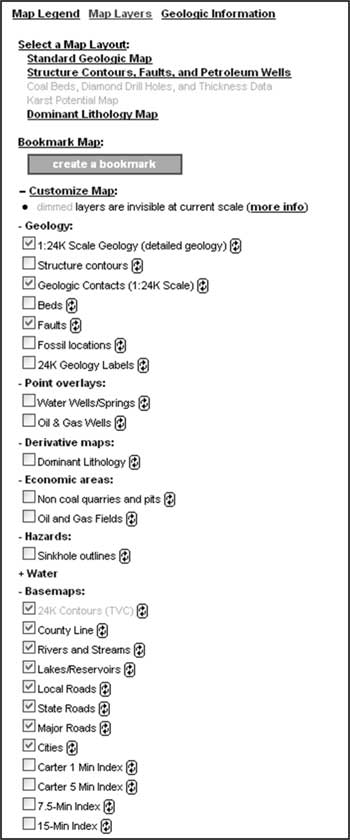
Figure 4. Map layers tab, with predefined and custom map layouts.
Many users will want to compare geologic units to other kinds of map information. For example, sinkholes or quarry outlines can be superimposed on the map for analysis. Locations of a variety of point data, such as oil wells, water wells, coal measurements, sample locations, measured sections, and photographs, can also be added to the map. Data pertaining to those locations will be accessible through search tools. The site data included on this map service are maintained in a separate relational database, and these data may change on a daily basis. This has been a challenge for ArcIMS maps that require the points to be converted to spatial themes (shapefiles or SDE layers), because the service must be stopped while the theme is updated, in order to avoid corruption. The KGS geologic map service circumvents the problem by sending queries directly to the tabular databases to add graphic overlays of the point locations. The data shown on the geologic map are always current with respect to the tabular database. The disadvantage of this method is that the points cannot be queried directly to obtain attribute information. Custom query tools have been designed that simulate an identify tool. Rather than searching a spatial layer, the tool sends a coordinate-based query to the database for the attributes. This method turns out to be more efficient than querying spatial themes.
The map layers tab also provides a quick method of customizing the view—that is, standard layouts. These links, found at the top of the frame, represent commonly used, predesigned layouts that save users the time needed to browse through the "customize" theme list.
Once users have a map design that suits their purpose, the map can be bookmarked as a browser favorite for future viewing or for sending to a colleague. Two kinds of bookmarks are provided: (1) the map layout and its coordinate extent or (2) only the layout. Each unique bookmarked layout is stored in a KGS database and assigned an ID number. To retrieve a layout, the maps base URL need only contain an additional variable with the layout ID, and, optionally, the bounding coordinates of the view. An example bookmark would be:
http://kgsmap.uky.edu/website/KGSGeology/viewer.asp?LayoutID=&QueryZoom=Yes&startLeft=5272839.22544311&startRight=5292301.9485407&startTop=3941629.60683334&startBottom=3928155.41391963
Each published geologic quadrangle map includes a variety of descriptions for geologic units, as well as economic activities and other related subjects. These textual descriptions are being cataloged in a database to provide easy access with a map query tool (the black circle with white "i" on Figure 1). Users can click a location on any part of a map, and will receive a report of all available descriptions for that geologic unit, along with part of the stratigraphic column for context (Figure 5). Links are also provided to an online version of the original published map and a separate image of the full stratigraphic column. The stratigraphic columns are especially important, because the digital conversion of the geologic maps resulted in some changes to nomenclature and some mapped units were combined on the digital map. As a result, stratigraphic names contained in our digital map database and accessed through the Web map may not match those of the original, printed map. The unit descriptions are cataloged according to the original nomenclature, and the information report shows the hierarchical relationships between map units and descriptions. Original unit descriptions have also been subdivided where formal or informal parts or facies were described, but not mapped. Because of the sometimes complex relationship between unit descriptions and their spatial representation, the database contains the unit name associated with the description as well as the names of parent units on the published map and digital compilation.
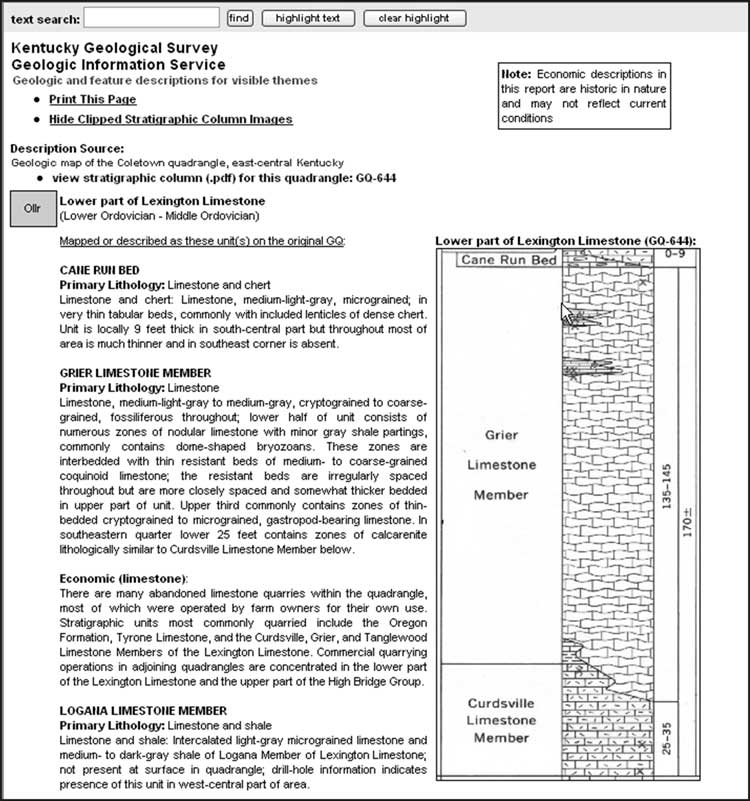
Figure 5. Lithology information results page, showing relationship between descriptions and map units.
Most of the original geologic quadrangle maps included a section called "Economic Geology." These paragraphs actually contain a diverse collection of information about economic activity (at the time of mapping), engineering, paleontology, archeology, land use, hydrology, geophysics, and structural geology. These descriptions have been cataloged according to topic, and those that pertain to specific geologic units will appear in the "identify report" for the unit that was selected.
In the same Web page report, the identify tool also returns information about other visible thematic features in the view area. For example, if there is a quarry and measured section in close proximity to the selected location, summary information will appear for those features at the bottom of the report. Most features will also contain links to extended data, such as the interval descriptions for a measured section, electric logs for an oil well, or commodity information for a quarry.
Whereas the map query or "identity" tool provides descriptions for a single location, the geologic information tab in the right frame (see Figure 3) provides a more comprehensive search for all information pertaining to the viewable map area (Figure 6). The "geologic information" functions work by searching the KGS description database by map coordinate extent, rather than by map attributes. Two kinds of searches are performed simultaneously by this "extent" tool. Data represented by point locations (e.g., wells or photos) can be searched by their coordinate values. Other geologic descriptions and images are identified by their association with a published or unpublished source that has an assigned map extent overlapping the user's view. The geologic information tool provides individual links to each kind of information rather than a single report. This is because of the potentially large amount of data that can be returned to a user in a single request.
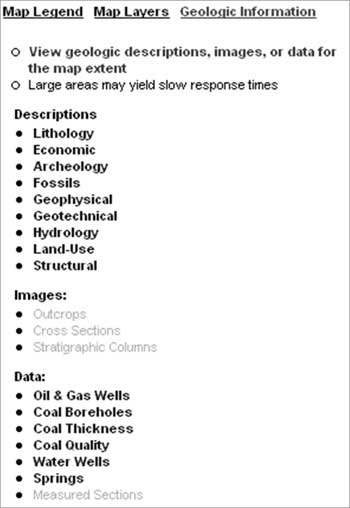
Figure 6. Subject and feature categories accessed from the geologic information tab. Grayed items not yet implemented.
Extent queries may return descriptions from multiple sources, if the user's view includes more than one geologic map, or because there are descriptions in the database from other kinds of sources, such as published reports or unpublished observations. Consequently, the results are initially sorted by source type and scale, then individual sources. As an alternative, lithology reports can be sorted by stratigraphic unit so that users can compare descriptions on adjacent maps for a single unit. All reports also provide a text search function to locate occurrences of keywords of interest.
The new KGS Geologic Map and Information site was released in beta version in April 2005. All of the functions described in this paper work for limited data sets in central, eastern, and western Kentucky. The next phase of development is to add the remainder of the spatial data to the ArcSDE database, including geologic themes, as well as additional related data, such as karst groundwater dye-trace results. A number of point feature types, including coal information, photographs, measured sections, and Natural Resource Conservation Service observation points, must be added to the layer list. A derivative classification for karst potential index has been developed and will be added in the near future. The most significant amount of future work will be preparing and loading text descriptions from the remaining 643 published geologic maps. This is expected to take an additional year.
Another related effort is a Web application that permits geologists to submit unpublished descriptions, observations, and images to the geologic information system. This system, currently under development, will allow approved users to catalog their knowledge about Kentucky rock units in the same database designed for published geologic maps. They will also be able to add and annotate photographs that they have taken of geologic features, and all these data will become available to users of the geologic map site.
Anderson, W.H., Morris, L.G., and Sparks, T.N., 1997, Semi-automated data capture for vectorizing geological quadrangle maps in Kentucky, in Soller, D.R., ed., Digital Mapping Techniques 1997, Workshop Proceedings, U.S. Geological Survey Open File Report 97-269, p. 9-13, available at http://pubs.usgs.gov/of/of97-269/anderson.html.

![]() U.S. Department of the Interior |
U.S. Geological Survey
U.S. Department of the Interior |
U.S. Geological Survey
URL: pubsdata.usgs.gov /pubs/of/2005/1428/weisenfluh/index.html
Page Contact Information: David R. Soller
Page Last Modified: Saturday, 12-Jan-2013 22:05:28 EST
