 |
|
|
||||
| Upper Midwest Environmental Sciences Center |
By Brian S. Ickes
U.S. Geological Survey Open File Report 2006-1074
This report is available as a pdf.
Environmental monitoring programs are frequently designed to track changes in key physical, chemical, and biological features of an ecosystem. As such, these programs provide critical information for detecting changes in system state, investigating mechanisms associated with observed changes, and making resource management decisions. Because monitoring programs require significant investments of time, money, and human resources, periodic evaluations of monitoring programs are necessary to determine if the sampling design adequately addresses program goals and objectives. Periodic evaluations also permit assessment of a program’s ability to provide adequate and useful information for changing management and science needs.
In 2001, we evaluated the Long Term Resource Monitoring Program (LTRMP) sampling design for fish on the Upper Mississippi River System by analyzing data from stratified random samples collected during 1993–1999 in six Resource Trend Areas (RTA; Figure). Specifically, we investigated whether the sampling design could provide nearly the same amount of information it presently does with fewer sampling gears. Results and recommendations are in Ickes and Burkhardt (2002); available at http://www.umesc.usgs.gov/documents/reports/2002/02t001.pdf. Our goals were to assess information provided by each gear used to monitor fishes in the LTRMP, engage program partners in a discussion on the relative value of each gear within the present sampling design, develop alternative sampling designs based on simulations of historical program data and expert opinion, and optimize the implementation of various alternative designs. Following our investigation and consultation with program partners, we eliminated 4 of the 10 gears used since program initiation in 1989.
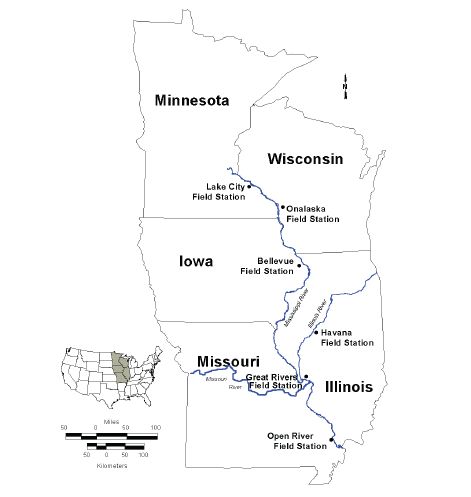 |
| Figure. The Upper Mississippi River System and locations of the six Resource Trend Areas monitored by the Long Term Resource Monitoring Program. |
Collections from 2002 provided the first opportunity to assess the accuracy of our predictions. We were unable to incorporate additional contemporary data because sampling was curtailed in the northern RTAs in 2003, and curtailed for the full program in 2004. These reductions were budget driven and independent of studied and planned gear reductions implemented in 2002. Thus, data deriving from 2003 and 2004 have questionable value in a prediction validation context for assessing the quantitative effects of 2002 gear reductions. Based on simulations of program data from 1993 to 1999, our investigation in 2001 predicted that a six-gear design would retain 65% of historical annual catch, but with considerable variation among RTAs (Table 1). In 2002, total program catch was more than 2 times greater than predicted from historical data simulations. Three RTAs observed higher than predicted total annual catches (Pools 13 and 26 and La Grange Pool) and three observed lower than predicted catches (Pools 4 and 8 and Open River). Much of the difference between predicted and observed total annual catch, for the entire program and among RTAs, was because the largest gizzard shad (Dorosoma cepedianum) and threadfin shad (D. petenense) catches on record occurred in 2002.
Table 1. For each Resource Trend Area (RTA) within the Long Term Resource Monitoring Program (LTRMP), the mean annual total catch of fish under 10-gear sampling design from 1993 to 1999, and the predicted and observed catch under the 6-gear sampling design implemented in 2002. Numbers in parentheses are the percentage of the total catch under the 10-gear sampling design that was predicted and observed in 2002 under the 6-gear sampling design
| RTA | Mean Annual Total Catch | ||
|---|---|---|---|
| 10-gear design | Predicted 6-gear design | Observed 6-gear design | |
| Pool 4 | 68,857 |
46,857 (68%) |
36,945 (54%) |
| Pool 8 | 54,000 |
26,143 (48%) |
22,574 (42%) |
| Pool 13 | 46,571 |
17,714 (38%) |
36,750 (79%) |
| Pool 26 | 25,429 |
18,286 (72%) |
47,820 (188%) |
| Open River | 17,571 |
17,143 (98%) |
11,804 (67%) |
| La Grange Pool | 83,286 |
67,000 (80%) |
270,905 (325%) |
| Total | 295,714 |
193,143 (65%) |
426,798 (144%) |
During our evaluation in 2001, we also predicted that annual collections under the six-gear design should result in 9% reduction in the total number of species collected annually for the entire program (Table 2). As predicted, the fish component observed an overall 9% reduction relative to the historical average. However, differences between predicted and observed annual species counts varied among RTAs. Annual species counts in 2002 were below predictions for Pools 4, 8, and 26 and Open River, whereas in La Grange Pool we observed the same number as predicted, and in Pool 13 we observed one more species than predicted. It is difficult to place these deviations into context with only 1 year of post-design change data. We do expect annual species counts to vary over time because all of the predicted losses in annual species detection were associated with species uncommon in the catch, making their detection uncertain for any given year.
Table 2. For each Resource Trend Area (RTA) of the Long Term Resource Monitoring Program (LTRMP), the number of fish species collected each year and the seven-year annual mean under the 10-gear design, 1993 1999, and the predicted and observed number of species under the 6-gear design in 2002 along with the difference between the numbers predicted and observed (percent deviance from the 7-year mean in parentheses).
| Year | Resource Trend Area | ||||||
|---|---|---|---|---|---|---|---|
| Pool 4 | Pool 8 | Pool 13 | Pool 26 | Open River | La Grange | Program Total | |
10-gear design |
|||||||
| 1993 | 73 |
78 |
65 |
62 |
66 |
64 |
111 |
| 1994 | 74 |
75 |
61 |
62 |
61 |
63 |
107 |
| 1995 | 59 |
72 |
61 |
70 |
72 |
68 |
108 |
| 1996 | 66 |
75 |
59 |
67 |
67 |
69 |
111 |
| 1997 | 71 |
76 |
67 |
66 |
67 |
66 |
113 |
| 1998 | 68 |
75 |
65 |
63 |
63 |
75 |
115 |
| 1999 | 73 |
72 |
69 |
67 |
71 |
65 |
114 |
| Average (1993-1999) | 69 |
75 |
64 |
65 |
67 |
67 |
111 |
6-gear design in 2002 |
|||||||
| Predicted | 64 (-7%) |
70 (-7%) |
58 (-9%) |
62 (-5%) |
65 (-3%) |
67 (-0%) |
101 (-9%) |
| Observed | 58 (-16%) |
65 (-3%) |
59 (-8%) |
59 (-9%) |
63 (-6%) |
67 (-0%) |
101 (-9%) |
| Difference | -6 |
-5 |
+1 |
-3 |
-2 |
0 |
0 |
The value of changes to a monitoring network must be weighed against the costs of ceasing to collect particular types of data. Periodic evaluations of monitoring data force those responsible for implementing a program to critically assess the scientific and fiscal performance of the monitoring network. It also encourages users of program data to critically assess the value of the information provided in the context of their management and science needs. Such reflection is the foundation of an adaptive, partnership program. Details of the options considered by the partnerhship and subsequent analyses are in Ickes and Burkhardt (2002). The reductions in fish sampling gear implemented by the LTRMP in 2002 resulted in savings of time, effort, and money, with little apparent loss of information. Thus, the evaluation process used to assess these changes appears to have been successful in creating efficiencies within the Program while still achieving program goals.
Ickes, B. S., and R. W. Burkhardt. 2002. Evaluation and proposed refinement of the sampling design for the Long Term Resource Monitoring Program’s fish component. U.S. Geological Survey, Upper Midwest Environmental Sciences Center, La Crosse, Wisconsin, October 2002. LTRMP 2002-T001. 17 pp. + Appendixes A–E. CD-ROM included. (NTIS #PB2003-500042)
This report is available as a pdf. (164KB)
This report requires the Adobe Reader® to view (version 5 or higher preferred). If you do not have the Adobe Reader, it is available for free download from Adobe Systems, Inc.
Document Accessibility: Adobe Systems, Inc. has information about PDFs and the visually impaired. This information provides tools to help make PDF files accessible. These tools convert Adobe PDF documents into HTML or ASCII text, which then can be read by screen-reading programs that synthesize text as audible speech. In addition, a version of Adobe Reader that contains support for screen readers is available. The conversion tools and the accessible reader may be obtained free from Adobe through their conversion tools Web site.
For more information contact
Brian S. IckesFor information about water-resource studies in the State of Upper Midwest Environmental Sciences Center, please visit our Web site at http://www.umesc.usgs.gov.
| AccessibilityFOIAPrivacyPolicies and Notices | |
 |
|