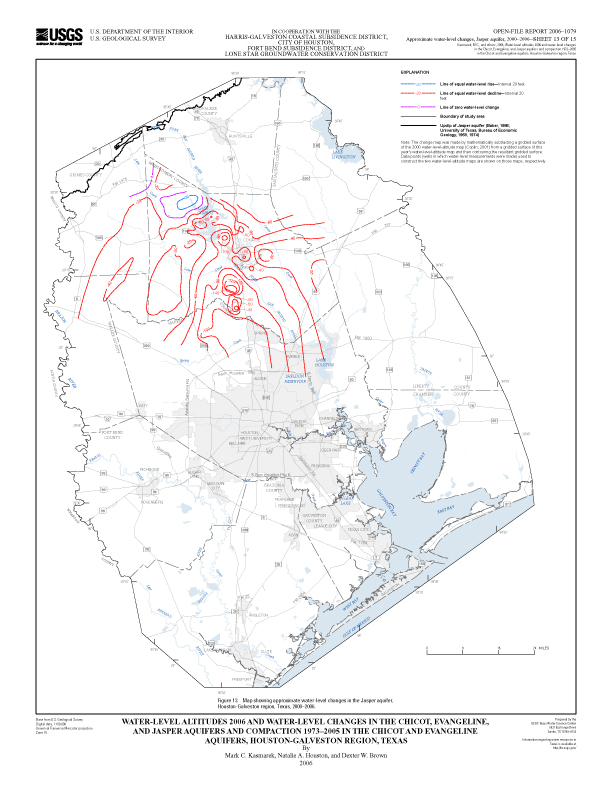
Figure 13. Map showing approximate water-level changes in the Jasper aquifer, Houston-Galveston region, Texas, 2000–06.
Contents | Back to Text | Figure 14