USGS


Cross-section profiles of relative dye concentation and depth on 08/02/2005 at cross section OH 6 in the Ohio River. click to see larger image click to see larger image


Figure 7. Cross-section profiles of relative dye concentration and depth on 08/02/2005 at cross section OH 6 in the Ohio River.


Cross-section profiles of relative dye concentation and depth on 08/02/2005 at cross section OH 8 in the Ohio River. click to see larger image click to see larger image

Figure 8. Cross-section profiles of relative dye concentration and depth on 08/02/2005 at cross section OH 8 in the Ohio River.


Cross-section profiles of relative dye concentation and depth on 08/02/2005 at cross section OH 10 in the Ohio River. click to see larger image click to see larger image

Figure 9. Cross-section profiles of relative dye concentration and depth on 08/02/2005 at cross section OH 10 in the Ohio River.


Cross-section profiles of relative dye concentation and depth on 08/02/2005 at cross section OH 11 in the Ohio River. click to see larger image click to see larger image

Figure 10. Cross-section profiles of relative dye concentration and depth on 08/02/2005 at cross section OH 11 in the Ohio River.


Cross-section profiles of relative dye concentation and depth on 08/02/2005 at cross section OH 12 in the Ohio River. click to see larger image click to see larger image

Figure 11. Cross-section profiles of relative dye concentration and depth on 08/02/2005 at cross section OH 12 in the Ohio River.


Cross-section profiles of relative dye concentation and depth on 08/02/2005 at cross section OH 13 in the Ohio River. click to see larger image click to see larger image

Figure 12. Cross-section profiles of relative dye concentration and depth on 08/02/2005 at cross section OH 13 in the Ohio River.


Cross-section profiles of relative dye concentation and depth on 08/02/2005 at cross section OH 14 in the Ohio River. click to see larger image click to see larger image

Figure 13. Cross-section profiles of relative dye concentration and depth on 08/02/2005 at cross section OH 14 in the Ohio River.


Cross-section profiles of relative dye concentation and depth on 08/02/2005 at cross section OH 15 in the Ohio River. click to see larger image click to see larger image

Figure 14. Cross-section profiles of relative dye concentration and depth on 08/02/2005 at cross section OH 15 in the Ohio River.


Cross-section profiles of relative dye concentation and depth on 08/02/2005 at cross section OH 16 in the Ohio River. click to see larger image click to see larger image

Figure 15. Cross-section profiles of relative dye concentration and depth on 08/02/2005 at cross section OH 16 in the Ohio River.


Plot of maximum measured dye concentration as a function of distance from injection point for 08/02/2006 (downstream) tracer study on the Ohio River.

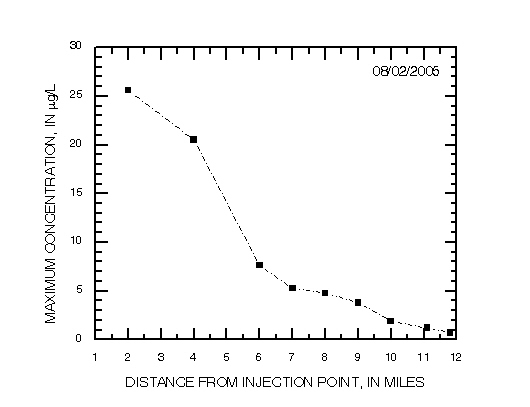
Figure 17. Maximum measured dye concentration as a function of distance from injection point for 08/02/2006 (downstream) tracer study on the Ohio River.


Cross-section profiles of relative dye concentration and depth on 08/03/2005 at cross section OH 15 in the Ohio River. click to see larger image click to see larger image

Figure 18. Cross-section profiles of relative dye concentration and depth on 08/03/2005 at cross section OH 15 in the Ohio River.


Cross-section profiles of relative dye concentration and depth on 08/03/2005 at cross section OH 16 in the Ohio River. click to see larger image click to see larger image

Figure 19. Cross-section profiles of relative dye concentration and depth on 08/03/2005 at cross section OH 16 in the Ohio River.


Cross-section profiles of relative dye concentration and depth on 08/04/2005 at cross section OH 1 in the Ohio River. click to see larger image click to see larger image


Figure 20. Cross-section profiles of relative dye concentration and depth on 08/04/2005 at cross section OH 1 in the Ohio River.


Cross-section profiles of relative dye concentration and depth on 08/04/2005 at cross section OH 2 in the Ohio River.
click to see larger image click to see larger image

Figure 21. Cross-section profiles of relative dye concentration and depth on 08/04/2005 at cross section OH 2 in the Ohio River.


Cross-section profiles of relative dye concentration and depth on 08/04/2005 at cross section OH 3 in the Ohio River. click to see larger image click to see larger image

Figure 22. Cross-section profiles of relative dye concentration and depth on 08/04/2005 at cross section OH 3 in the Ohio River.


Cross-section profiles of relative dye concentration and depth on 08/04/2005 at cross section OH 4 in the Ohio River. click to see larger image click to see larger image

Figure 23. Cross-section profiles of relative dye concentration and depth on 08/04/2005 at cross section OH 4 in the Ohio River.


Cross-section profiles of relative dye concentration and depth on 08/04/2005 at cross section OH 5 in the Ohio River. click to see larger image click to see larger image

Figure 24. Cross-section profiles of relative dye concentration and depth on 08/04/2005 at cross section OH 5 in the Ohio River.


Cross-section profiles of relative dye concentration and depth on 08/04/2005 at cross section OH 6 in the Ohio River. click to see larger image click to see larger image

Figure 25. Cross-section profiles of relative dye concentration and depth on 08/04/2005 at cross section OH 6 in the Ohio River.


Cross-section profiles of relative dye concentration and depth on 08/04/2005 at cross section OH 7 in the Ohio River. click to see larger image click to see larger image

Figure 26. Cross-section profiles of relative dye concentration and depth on 08/04/2005 at cross section OH 7 in the Ohio River.


Cross-section profiles of relative dye concentration and depth on 08/04/2005 at cross section OH 8 in the Ohio River. click to see larger image click to see larger image

Figure 27. Cross-section profiles of relative dye concentration and depth on 08/04/2005 at cross section OH 8 in the Ohio River.


Cross-section profiles of relative dye concentration and depth on 08/04/2005 at cross section OH 9 in the Ohio River. click to see larger image click to see larger image

Figure 28. Cross-section profiles of relative dye concentration and depth on 08/04/2005 at cross section OH 9 in the Ohio River.


Plot of maximum measured dye concentration as a function of distance from injection point for 08/04/2006 (upstream) tracer study on the Ohio River.

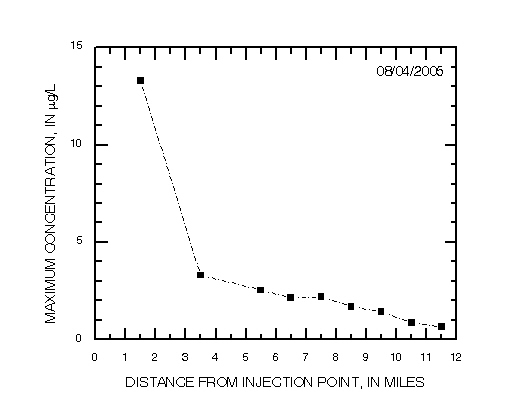
Figure 29. Maximum measured dye concentration as a function of distance from injection point for 08/04/2006 (upstream) tracer study on the Ohio River.