Coastal and Marine Geology
|
 Figure 1: Upper Yuba River Watershed Studies Program (UYRSP) area. Small rectangle (in red) around Englebright Lake shows the geographic limits of the maps in this report. |
In March, 2004, the USGS conducted a swath bathymetric survey of Englebright Lake, a 9-mile long reservoir located in the Sierra Nevada foothills of northern California on the Yuba River. This survey was follow-on to an earlier bathymetric survey and sediment thickness analysis done by the USGS in 2001 (Childs and others, 2003). The primary purpose of these studies is to assess the quantity and nature of the sediment that has accumulated since the dam was completed in 1940. The specific purpose of the swath bathymetry was to map in high detail the prograding delta that is being formed as the lake fills in with sediment. In the event of another large flood such as occurred on January 1, 1997, the survey could be repeated to determine the effect of such an event on the sediment volume and distribution.
This study was conducted under the auspices of the Upper Yuba River Studies Program (UYRSP) . The UYRSP is funded by the CALFED Bay-Delta Program, whose mission is to "develop and implement a long-term comprehensive plan that will restore ecological health and improve water management for beneficial uses of the San Francisco Bay-Delta System".
The principal bathymetric survey (USGS Field Activity ID F-1-04-NC ) was conducted in March, 2004, using the R/V Frontier, a 25-foot Boston Whaler (Photo 1).
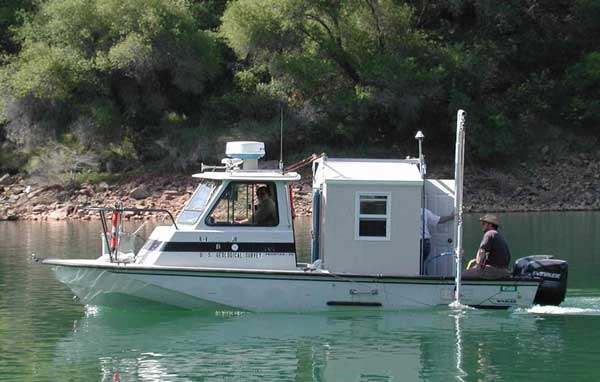
Photo 1. Research Vessel Frontier, on Englebright Lake in March, 2004. SwathPlus transducers are mounted on the pole toward the stern of the vessel.
The bathymetry was measured with an SEA (Group) SWATHPlus-M instrument (http://www.sea.co.uk/swathplus.html). This instrument utilizes interferometric sonar technology (operating at 234 kHz) to measure depth along a swath perpendicular to the direction of ship travel. The usable swath width can be as great as 10 times water depth, to a maximum of 300 meters (984 ft). Depth accuracy is nominally 0.1 m (4 in) or 1% of water depth.
Soundings data were processed as follows: during data collection, a series of autofilters were applied to the incoming data stream to reject sounding solutions which plotted significantly away from the primary bottom trace, eliminating most spurious solutions. For each ping, soundings which passed the autofilters were averaged into 10 cm (crosstrack) bins, and written to a processed soundings file. In addition, all solutions (unfiltered) were written to a separate raw soundings file.
Post data collection, the processed soundings file for each swath (line) in the survey area were combined and gridded to produce a file of regularly spaced (1 meter cell size) depth soundings. All soundings within a grid cell were averaged together to establish a cell depth value. The 1 meter grid data were then further edited to remove cells with dubious values. Cells which showed significant internal soundings disagreement (standard deviations in excess of 0 .4) were rejected. Cells which showed significant depth divergence from their immediate neighbors (DeSpike, 1m or greater from surrounding average) were rejected. A boxcar smoothing filter (3x3 grid) was run to suppress high frequency variation and to enhance true lakebed features. Finally the data was rendered in 3D and visually edited to remove any remaining anomalous soundings.
The editing criteria used in processing this dataset was designed to reject all questionable soundings, with the objective of ensuring that all soundings in the final grid were valid. This inevitably resulted in some valid data being also rejected. Different processing criteria would result in more complete coverage, but also increase the number of “bad” soundings present in the grid. Despite the somewhat severe criteria, the final grid contains in excess of 1.3 million data points.
The SWATHPlus did not return consistent results in the deepest portion (60 m, or 197 ft) of the reservoir; depths of 50 meters (164 ft) and less were more consistently tracked. An area of particular interest was the prograding delta front (Figures 3-4), where water depth shallows from approximately 35 m (115 ft) to 15 m (50 ft) over a distance of just over a 1 km (3300 ft.)
Navigation was measured with a CSI DGPS Max, logged with the USGS PC-based data acquisition package YoNav. The CSI DGPS receiver is capable of operating in Differential (DGPS) and Wide Area Augmentation System (WAAS) GPS modes, both of which are available in the Englebright Lake vicinity. (WAAS reception was, however, sporadic in the uppermost reaches of the lake, due probably to steep terrain.) The DGPS Max receiver has a manufacturer-specified horizontal accuracy of less than 1 meter (95%) in DGPS mode; WAAS results are somewhat more accurate.
The level of the lake varies due to releases from the dam and variable inflow. However, during the 8 hours required for the swath survey, the level as reported by the US Army Corps of Engineers at: http://cdec.water.ca.gov/cgi-progs/staMeta?station_id=ENG
changed by only approximately 0.15 m (6 in), which is roughly the accuracy of the depth measurement. In addition, the lake level is measured at the dam, and the propagation of inflow is not instantaneous. Therefore, corrections for lake level were considered unnecessary. The water depths were corrected to a vertical datum of 160.6 m (527.0 ft) , the elevation of the dam spillway.
In March, 1998, the engineering firm Chris Ransome & Associates Northwest (CRA-NW) was subcontracted by Bookman-Edmonston Engineering to conduct a swath bathymetry and subbottom profile survey of the reservoir in the area immediately upstream - about 150 meters (500 feet) - of the dam. That survey reported a reservoir bottom elevation of between 330 and 335 feet (101 and 102 meters), which is slightly higher than the 325 to 327 foot (99.1 to 99.7 meter) elevation reported here. The CRA-NW data were not incorporated into any of the results in this report.
In 2001 and 2002, the USGS conducted bathymetric and geophysical surveys of the lake (Childs and others, 2003), and in 2002 thirty boreholes were drilled at seven sites spaced along the longitudinal axis of the reservoir sites (Snyder and others, 2004a, 2004b).
Results of these earlier studies were reported by Snyder and Hampton (2003) and Snyder and others (2004c).
The raw swath data were edited to remove values that were considered unreliable. The bathymetry of the lake was projected onto a 1-meter grid, producing 1,378,439 depth values within the lake. The 1-meter values were regridded at approximately 6-meter (20-foot) grid interval using the blockmedian and surface algorithms in Generic Mapping Tools. The blockmedian algorithm filters and grids the input (x,y,z) data using L1 norm, and surface creates a continuous curvature surface. A tension value 0.4 was used in the surface process. The resulting reservoir bathymetry is shown in Figure 2. Areas colored black or uncolored are regions of no data or unreliable data.
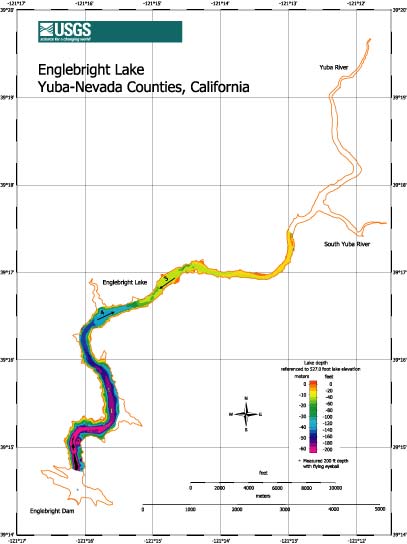
Figure 2. Swath bathymetry data regridded from original 1-meter interval, fit
with a spline surface, and contoured. Arrows show view direction in Figures
3 and 4 below.
Figures 3 and 4, show perspective views of the 1-meter bathymetry, with no vertical exaggeration viewed in the downstream and upstream directions. Data have been interpolated to fill gaps in the original field data acquisition.
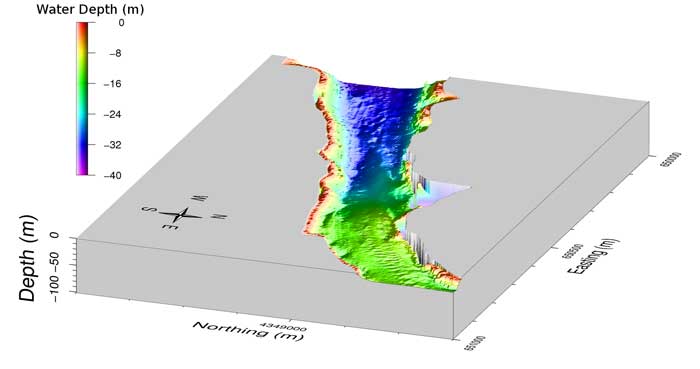
Figure 3 . Perspective view of upper sediment delta viewed downstream (no vertical exaggeration).
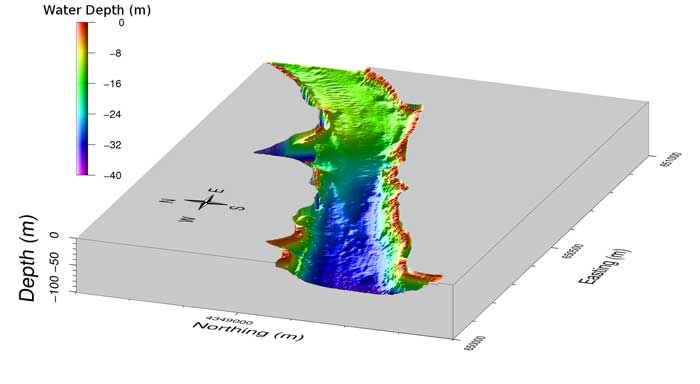
Figure 4 . Perspective view of sediment delta vewed upstream (no vertical exaggeration).
The data are available in comma-delimited, ASCII format. The file consists of 1,378,439 records; each record corresponding to a 1-meter UTM (Zone 10), WGS84 datum cell and average computed depth within the cell. Data accuracy is difficult to quantify because of the complexity of the data acquisition and processing; however, standard deviation of the swath values is estimated to be 10 to 30 cm. In both files, the depth values are negative meters relative to 160.5 m (527 ft) elevation. Adding the depth to 160.5 will yield the elevation of the lake bottom. Data may be downloaded from: http://walrus.wr.usgs.gov/infobank/f/f104nc/html/f-1-04-nc.meta.html
No further work on the lake is planned at this time. A follow-on survey would be appropriate in the event of a major flood event.
The authors would like to thank: Larry Kooker, Gerald O'Brien, Mike Boyle, and Greg Gable (all of the USGS) for their assistance in conducting the field program. Funding for this study was provided by the CALFED Ecosystem Restoration Program. Noah Snyder, Charlie Alpers, and Pete Dartnell kindly reviewed the report. David Finlayson provided the perspective figures 3 and 4.
Childs, J.R., Snyder, N.P., and Hampton, M.A., 2003, Bathymetric and geophysical surveys of Englebright Lake, Yuba-Nevada Counties, California, U.S. Geological Survey Open-File Report 03-383 http://geopubs.wr.usgs.gov/open-file/of03-383/
Snyder, N.P. and Hampton, M.A., 2003, Preliminary Cross Section of Englebright Lake Sediments, U.S. Geological Survey Open-File Report 2003-397 http://geopubs.wr.usgs.gov/open-file/of03-397/
Snyder, N. P., Alpers, C. N., Flint, L. E., Curtis, J. A., Hampton, M. A., Haskell, B. J., and Nielson, D. L., 2004a, Report on the May-June 2002 Englebright Lake Deep Coring Campaign, U.S. Geological Survey Open-File Report 2004-1061 http://pubs.usgs.gov/of/2004/1061/
Snyder, N.P., Allen, J.R., Dare, C., Hampton, M.A., Schneider, G., Wooley, R.J., Alpers, C.N., and Marvin-DiPasquale, M.C., 2004b, Sediment Grain-Size and Loss-on-Ignition Analyses from 2002 Englebright Lake Coring and Sampling Campaigns, U.S. Geological Survey Open-File Report 2004-1080 http://pubs.usgs.gov/of/2004/1080/
Snyder, N. P., Rubin, D. M., Alpers, C. N., Childs, J. R., Curtis, J. A., Flint, L. E., and Wright, S. A., 2004c, Estimating accumulation rates and physical properties of sediment behind a dam: Englebright Lake, Yuba River, northern California, Water Resources. Research, 40, W11301, doi:10.1029/2004WR003279.
Upper Yuba River Studies Program
CALFED Bay-Delta Program
Coastal and Marine Geology InfoBank
Generic Mapping Tools
For questions about the content of this report contact
Jon R. Childs
U.S. Geological Survey Mail Stop 999
345 Middlefield Rd.
Menlo Park, CA 94025-3561
650-329-5195
jchilds@usgs.gov
This report is available only on the Web
|

![]() U.S. Department of the Interior | U.S. Geological Survey
U.S. Department of the Interior | U.S. Geological Survey
URL: http://pubs.usgs.gov/of/2006/1346/
Page Maintained By: Michael Diggles
Page Last Modified: November 14, 2006 (mfd)