Report Site Map > Methods for Determining Net Nutrient Flux for Five Large Subbasins Comprising the Mississippi-Atchafalaya River Basin
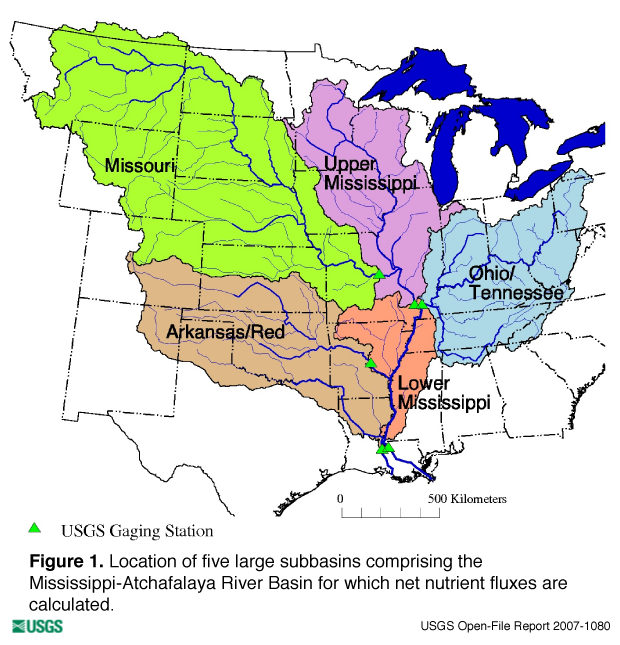
The Mississippi-Atchafalaya River Basin (MARB) has been subdivided into large subbasins for various management activities (such as the Mississippi River Basin and Gulf of Mexico Hypoxia Task Force and scientific reports (Goolsby and others, 1999). In these cases, the sum of streamflow and nutrient fluxes for the large subbasins equal the total streamflow and nutrient fluxes for the entire Mississippi-Atchafalaya River Basin. Herein, we define the contributions of streamflow and net nutrient flux for five large subbasins: 1. Lower Mississippi, 2. Upper Mississippi, 3. Ohio/Tennessee, 4. Missouri, and 5. Arkansas/Red (figure 1). These data are calculated using nutrient flux estimates at seven stations available in this report and listed in table 1. These stations are located downstream and/or upstream of the mouth of each of the 5 major subbains. Table 1 also includes the formulas used to calculate the nutrient flux for each subbasin. Generally, the net nutrient fluxes for individual subbasins were calculated by summing the effluent (downstream) station fluxes and subtracting the influent (upstream) station fluxes. Using this approach, it is possible to have a negative net nutrient flux for a subbasin where effluent (downstream) fluxes are less than influent (upstream) fluxes. Negative net nutrient flux values can be the result of error in the flux estimates at the individual monitored stations and/or a real net loss of nutrients within the subbasin. |
| Subbasin | Formula Used to Calculate Subbasin Nutrient Flux |
|---|---|
| 1. Lower Mississippi |
Mississippi River near St. Francisville, La. plus Atchafalaya River at Melville, La. minus Mississippi River at Thebes, Ill. minus Ohio River at Dam 53 near Grand Chain, Ill. minus Arkansas River below Little Rock, Ark. minus Red River at Alexandria, La. |
| 2. Upper Mississippi |
Mississippi River at Thebes, Ill. minus Missouri River at Hermann, Mo. |
| 3. Ohio/Tennessee | Ohio River at Dam 53 near Grand Chain, Ill. |
| 4. Missouri | Missouri River at Hermann, Mo. |
| 5. Arkansas/Red |
Arkansas River below Little Rock, Ark. plus Red River at Alexandria, La. |
Confidence intervals for the net nutrient fluxes of each subbasin were determined by adding in quadrature (that is, squared, added, and then square rooted (Kirchner, 2001)). The magnitude of the flux-estimate confidence intervals for each of the stations involved in the calculation are accumulated in quadrature, no matter whether the station fluxes were added or subtracted. This assumes that the nutrient fluxes from the stations involved in the calculations are independent of each other, which is a reasonable assertion (see discussion in "Procedures for Computing Aggregate Fluxes and Associated 95 Percent Confidence Intervals" section near bottom of "Methods Used to Estimate Nutrient Fluxes" page).
Confidence intervals were calculated on a water year basis for the period 1979–2005, for which there were continuous nutrient flux estimates for most nutrients at all the relevant stations. Constituent flux estimates were not available for all years at some stations for dissolved orthophosphate and dissolved silica (due to lack of water-quality data), which made it impossible to conduct a long-term inter-subbasin comparison for these two nutrients. The net subbasin nutrient fluxes also were summarized for five 5-year periods and for the 25-year period including water years 1981 through 2005. Confidence intervals were not calculated for the longer 5-year periods and for the 1981–2005 period due to the complexity of determining the confidence intervals from a series of separate, but correlated, annual flux estimates.
The confidence intervals for total nitrogen, which were determined from the confidence intervals from dissolved nitrite plus nitrate and total Kjeldahl nitrogen, were estimated assuming that dissolved nitrite plus nitrate and total Kjeldahl nitrogen have a correlation coefficient of one; that is, there is a perfect linear relation with each other. While this is not true, it is apparent that there is a significant amount of correlation between these two water-quality constituents, whereas the actual amount of correlation is unknown. This approach of setting the correlation coefficient to one provides a "worst-case scenario" to bound the confidence interval, with the actual range in the confidence interval being likely smaller (Mullaney and others, 2002; appendix 2, pp. 38-39). The equation for estimating the confidence interval for total nitrogen (CI(X + Y)) is:
| CI(X + Y) = √(CI(X)2 + 2 * r(X,Y) * CI(X) * CI(Y) + CI(Y)2) | (1) |
where
CI is the magnitude of the nutrient flux estimate either above or below the mean flux;
X is dissolved nitrite plus nitrate;
Y is total Kjeldahl nitrogen; and
r(X,Y) is the correlation coefficient between the two water-quality constituents and is assumed to be one.
Goolsby, D.A., Battaglin, W.A., Lawrence, G.B., Artz, R.S., Aulenbach, B.T., Hooper, R.P., Keeney, D.R., and Stensland, G.J., 1999, Flux and sources of nutrients in the Mississippi-Atchafalaya River Basin—Topic 3, Report for the integrated assessment on hypoxia in the Gulf of Mexico: National Oceanic and Atmospheric Administration NOAA Coastal Ocean Program Decision Analysis Series No. 17, 129 p.
Kirchner, James, 2001, Data analysis toolkit #5—Uncertainty analysis and error propagation: Analysis of Environmental Data Course, University of California, Berkeley, Calif., 8 p.
Mullaney, J.R., Schwarz, J.R., Trench, E.C.T., 2002, Estimation of nitrogen yields and loads from basins draining to Long Island Sound, 1988-98: U.S. Geological Survey Water-Resources Investigations Report 2002–4044, 84 p.
Report Site Map > Methods for Determining Net Nutrient Flux for Five Large Subbasins Comprising the Mississippi-Atchafalaya River Basin

![]() U.S. Department of the Interior |
U.S. Geological Survey
U.S. Department of the Interior |
U.S. Geological Survey
URL: http://pubsdata.usgs.gov/pubs/of/2007/1080/of-2007-1080/methods_large_subbasins.html
Page Contact Information: GS Pubs Web Contact
Page Last Modified: Wednesday, 05-Mar-2025 14:48:43 EST