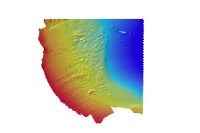
Data collected for the mapping cooperative have been released in a series of USGS Open-File Reports<http://woodshole.er.usgs.gov/project-pages/coastal_mass/html/current_map.html>. This spatial dataset is from the Cape Ann and Salisbury Beach Massachusetts project area. They were collected in two separate surveys in 2004 and 2005 and cover approximately 325 square kilometers of the inner continental shelf. High resolution bathymetry and backscatter intensity were collected in 2004 and 2005. Seismic profile data, sediment samples and bottom photography were also collected in 2005.
U.S. Geological Survey, 2008, CABATH5M_GEOG.TIF - 5 meter color-hillshaded relief GeoTIFF of both the inshore and offshore area of Cape Ann - Salisbury Beach Survey Area.: Open-File Report 2007-1373, U.S. Geological Survey, Coastal and Marine Geology Program, Woods Hole Science Center, Woods Hole, Massachusetts.This is part of the following larger work.Online Links:
Barnhardt, Walter A. , Andrews, Brian D. , Ackerman, Seth D. , Baldwin, Wayne E. , and Hein, Christopher J. , 2008, High-Resolution Geological Mapping of the Inner Continental Shelf: Cape Ann to Salisbury Beach, Massachusetts.: Open-File Report 2007-1373, U.S. Geological Survey, Coastal and Marine Geology Program, Woods Hole Science Center, Woods Hole, Massachusetts.Online Links:
This is a Raster data set. It contains the following raster data types:
Horizontal positions are specified in geographic coordinates, that is, latitude and longitude. Latitudes are given to the nearest 0.00014294599. Longitudes are given to the nearest 0.00014294599. Latitude and longitude values are specified in Decimal degrees.
The horizontal datum used is D_WGS_1984.
The ellipsoid used is WGS_1984.
The semi-major axis of the ellipsoid used is 6378137.000000.
The flattening of the ellipsoid used is 1/298.257224.
508-548-8700 x2348 (voice)
508-457-2310 (FAX)
bandrews@usgs.gov
The purpose of this data layer is to publish a GeoTIFF of the merged color-hillshade relief in Geographic coordinate system for display in the USGS Coastal and Marine Geology Internet Map Service.
Person who carried out this activity:
508-548-8700 x2348 (voice)
508-457-2310 (FAX)
bandrews@usgs.gov
Barnhardt, Walter A. , Andrews, Brian D. , and Butman, Bradford, 2006, High-Resolution Mapping of the Inner Continental Shelf: Nahant to Gloucester, Massachusetts: Open-File Report 2005-1293, U.S. Geological Survey, Coastal and Marine Geology Program, Woods Hole Science Center, Woods Hole, MA.Online Links:
Ackerman, Seth D. , Butman, Bradford, Barnhardt, Walter A. , Danforth, William W. , and Crocker, James M. , 2006, High-Resolution Geologic Mapping of the Inner Continental Shelf: Boston Harbor and Approaches, Massachusetts: Open-File Report 2006-1008, U.S. Geological Survey, Coastal and Marine Geology Program, Woods Hole Science Center, Woods Hole, MA.Online Links:
The horizontal accuracy of this merged grid varies, based on the accuracy of the input grids. The data in "bath_is5m" was collected using a Real-Time Kinematic GPS signal from a USGS base station established for the survey. The data in "bath_os5m" was collected using the Differential Global Positioning System signal from the U.S. Coast Guard.
The mean depth differences between nearshore (USGS) survey and the offshore (SAIC) data is 0.24 meters. The data from the two surveys overlap 150-200 meters along there common boundary. In the area of overlap, the offshore data is 0.24 meters (mean) shallower. These differences can be can be attributed to the use of differing tidal models for the two surveys. SAIC utilized a zoned tidal model provided by NOAA, whereas the USGS used kinematic water level heights recorded in real time aboard the R/V Connecticut A zoned tidal model is based on a compilation of historical water level heights, which take into account extreme highs and lows, and is generally very accurate. However, water level heights at the time of data collection are influenced by local wind and wave setup conditions that are not taken into account by the zoned tidal model. The kinematic water level heights recorded by the USGS aboard the R/V Connecticut reflect these local variations due to wind and wave setup and thus could account for the observed differences in the bathymetric surfaces generated by SAIC and the USGS.
Survey lines run for cross line junction analysis are not included in this grid.
Are there legal restrictions on access or use of the data?
- Access_Constraints: None
- Use_Constraints:
- Data are not intended for navigational use. The intended scale of these data is 1:25,000. Public domain data from the U.S. Government are freely redistributable with proper metadata and source attribution. Please recognize the U.S. Geological Survey (USGS) as the source of this information.
508-548-8700 x2348 (voice)
bandrews@usgs.gov
Downloadable Data
Neither the U.S. Government, the Department of the Interior, nor the USGS, nor any of their employees, contractors, or subcontractors, make any warranty, express or implied, nor assume any legal liability or responsibility for the accuracy, completeness, or usefulness of any information, apparatus, product, or process disclosed, nor represent that its use would not infringe on privately owned rights. The act of distribution shall not constitute any such warranty, and no responsibility is assumed by the USGS in the use of these data or related materials. Any use of trade, product, or firm names is for descriptive purposes only and does not imply endorsement by the U.S. Government.
| Data format: | WinZip file containing color-hillshaded GeoTIFF of bathymetric data collected in the Cape Ann to Salisbury Beach Survey Area. in format TIFF (version GeoTIFF) GeoTIFF Size: 2.5 Mb |
|---|---|
| Network links: |
<https://pubs.usgs.gov/of/2007/1373/GIS/raster/bathymetry/cabath5m_geog.zip> |
| Media you can order: |
DVD-ROM
(Density 4.75
Gbytes)
(format UDF)
Note: None
|
These data in a tiled GeoTIFF format are distributed as a compressed WinZip file. The user must have software capable of uncompressing a WinZip (ver. 9.0) file and viewing a tiled GeoTIFF data file.
508-548-8700 x2348 (voice)
508-457-2310 (FAX)
bandrews@usgs.gov