PHYSIOGRAPHIC ZONES - General physiographic zones of the inner continental shelf between Cape Ann and Salisbury Beach Massachusetts.

Metadata also available as - [Outline] - [Parseable text]

Frequently-anticipated questions:


What does this data set describe?

Title:
PHYSIOGRAPHIC ZONES - General physiographic zones of the inner continental shelf between Cape Ann and Salisbury Beach Massachusetts.
Abstract:
These data were collected under a cooperative agreement with the Massachusetts Office of Coastal Zone Management (CZM) and the U.S. Geological Survey, Coastal and Marine Geology Program, Woods Hole Science Center. Initiated in 2003, the primary objective of this program is to develop regional geologic framework information for the management of coastal and marine resources. Accurate data and maps of sea-floor geology are important first steps toward protecting fish habitat, delineating marine reserves, and assessing environmental changes due to natural or human impacts. The project is focused on the inshore waters (5-30m deep) of Massachusetts between the New Hampshire border and Cape Cod Bay.

Data collected for the mapping cooperative have been released in a series of USGS Open-File Reports (<http://woodshole.er.usgs.gov/project-pages/coastal_mass/html/current_map.html>). This spatial dataset is from the Cape Ann and Salisbury Beach Massachusetts project area. They were collected in two separate surveys in 2004 and 2005 and cover approximately 325 square kilometers of the inner continental shelf. High resolution bathymetry and backscatter intensity were collected in 2004 and 2005.

Supplemental_Information: The minimum mapping unit is 2,500 square meters.
  1. How should this data set be cited?

    U.S. Geological Survey, 2008, PHYSIOGRAPHIC ZONES - General physiographic zones of the inner continental shelf between Cape Ann and Salisbury Beach Massachusetts.: Open-File Report 2007-1373, U.S. Geological Survey, Coastal and Marine Geology Program, Woods Hole Science Center, Woods Hole, Massachusetts.

    Online Links:

    This is part of the following larger work.

    Barnhardt, Walter A. , Andrews, Brian D. , Ackerman, Seth D. , Baldwin, Wayne E. , and Hein, Christopher J. , 2008, High-Resolution Geological Mapping of the Inner Continental Shelf: Cape Ann to Salisbury Beach, Massachusetts.: Open-File Report 2007-1373, U.S. Geological Survey, Coastal and Marine Geology Program, Woods Hole Science Center, Woods Hole, Massachusetts.

    Online Links:

  2. What geographic area does the data set cover?

    West_Bounding_Coordinate: -70.816381
    East_Bounding_Coordinate: -70.597274
    North_Bounding_Coordinate: 42.874853
    South_Bounding_Coordinate: 42.655271

  3. What does it look like?

    <https://pubs.usgs.gov/of/2007/1373/GIS/browse_jpg/PhysiographicZones.jpg> (JPEG)
    Thumbnail jpg image of feature class

  4. Does the data set describe conditions during a particular time period?

    Beginning_Date: 23-Feb-2004, 20050908
    Ending_Date: 16-Mar-2004, 20050916
    Currentness_Reference: ground condition

  5. What is the general form of this data set?

    Geospatial_Data_Presentation_Form: vector digital data

  6. How does the data set represent geographic features?

    1. How are geographic features stored in the data set?

      This is a Vector data set. It contains the following vector data types (SDTS terminology):

      • G-polygon (148)

    2. What coordinate system is used to represent geographic features?

      Horizontal positions are specified in geographic coordinates, that is, latitude and longitude. Latitudes are given to the nearest 0.000000. Longitudes are given to the nearest 0.000000. Latitude and longitude values are specified in Decimal degrees.

      The horizontal datum used is D_WGS_1984.
      The ellipsoid used is WGS_1984.
      The semi-major axis of the ellipsoid used is 6378137.000000.
      The flattening of the ellipsoid used is 1/298.257224.

  7. How does the data set describe geographic features?

    PhysiographicZones
    Physiographic Zones (Source: USGS)

    Shape
    Feature geometry. (Source: ESRI)

    PhysZone
    Generalized Physiographic Zones using a coded subtype (Source: USGS)

    ValueDefinition
    1Nearshore Ramp-Areas of gently seaward sloping sand and gravel with complex bedforms. Depths 0-50 meters.
    2Rocky Zone-Areas of high-relief outcrops with bedrock, boulders and gravel. Depths 0-90 meters.
    3Shelf Valley-Areas of elongate depressions with rocky walls and sand and gravel thalwegs. Depths 12-25 meters.
    4Outer Basin-Areas of expansive smooth seafloor with muddy, thick sediment deposits. Depths greater than 50 meters.
    5Ebb Tidal Delta-Areas of broad sandy platforms seaward of inlets that are lobate in plan view. Depths less than 8 meters.

    Shape_Area
    Area of feature in meters (UTM 19, WGS84) squared automatically calculated by the software in the geodatabase. (Source: ESRI)

    PhyzAbr
    Abbreviation of physiographic zones (Source: USGS)

    ValueDefinition
    RZRocky Zone
    NRNearshore Ramp
    ETDEbb-tidal Delta
    SVShelf Valley
    OBOuter Basin

    FID
    Internal feature number. (Source: ESRI)

    Sequential unique whole numbers that are automatically generated.

    Entity_and_Attribute_Overview:
    The order of attributes in the attribute table may be different than the order of the Entity_and_Attribute_Information: Detailed_Description in this metadata file.


Who produced the data set?

  1. Who are the originators of the data set? (may include formal authors, digital compilers, and editors)

  2. Who also contributed to the data set?

  3. To whom should users address questions about the data?

    Brian Andrews
    U.S. Geological Survey
    Geographer
    384 Woods Hole Rd.
    Woods Hole, MA 02543-1598
    USA

    508-548-8700 x2348 (voice)
    508-457-2310 (FAX)
    bandrews@usgs.gov


Why was the data set created?

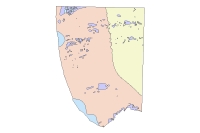
The purpose of this feature class is to qualitatively characterize the seafloor within the study area using five general physiographic zones. Geologic maps using these zones provide a regional view of the seafloor geology.


How was the data set created?

  1. From what previous works were the data drawn?

  2. How were the data generated, processed, and modified?

    Date: Aug-2007 (process 1 of 4)
    A blank polygon geodatabase feature class was made using the bathymetric footprint from the nearshore (05005) and offshore (04015) data The westward boundary of the layer was extended to the shoreline that was extracted from NOAA nautical chart 13282 Newburyport Harbor and Plum Island Sound (10th Ed., Dec 9/95.) Five subtypes were added to the feature class to reduce coding errors during the digitizing process. The 50 meter depth contour was added to this polygon to establish the boundary between the Outer Basin and Near shore Ramp zones. Additional zones were digitized using the "cut polygon" under editing option. Each polygon was digitized at a general zoom scale of 1:12,000. All geoprocessing was completed within ESRI ArcMap 9.1 software.

    Person who carried out this activity:

    Walter Barnhardt
    U.S. Geological Survey
    Geologist
    384 Woods Hole Rd.
    Woods Hole, MA 02543-1598
    USA

    508-548-8700 x2355 (voice)
    508-457-2310 (FAX)
    wbarnhardt@usgs.gov

    Date: Sep-2007 (process 2 of 4)
    Topology was built to identify any polygon overlaps, or gaps between zones. Any topological errors we validated and fixed using ArcMap 9.1 software.

    Person who carried out this activity:

    Brian Andrews
    U.S. Geological Survey
    Geographer
    384 Woods Hole Rd
    Woods Hole, MA 02543-1598
    USA

    508-548-8700 x2348 (voice)
    508-457-2310 (FAX)
    bandrews@usgs.gov

    Date: Jan-2008 (process 3 of 4)
    Converted feature class from ArcGIS ver 9.1 personal geodatabase to ArcGIS 9.2 file geodatabase using import feature class context menu in ArcCatalog 9.2

    Person who carried out this activity:

    Brian Andrews
    U.S. Geological Survey
    Geographer
    384 Woods Hole Rd
    Woods Hole, MA 02543-1598
    USA

    508-548-8700 x2348 (voice)
    508-457-2310 (FAX)
    bandrews@usgs.gov

    Date: Jun-2008 (process 4 of 4)
    Export feature class "PhysiographicZones" from ArcMap 9.2 file geodatabase to shapefile "PhysiographicZones.shp" using "Feature Class To Shapefile (multiple)" in ArcCatalog (ver 9.2) Conversion Toolbox. Environmental settings during conversion set output coordinates system as Geographic coordinate system WGS84.

    Person who carried out this activity:

    Brian Andrews
    U.S. Geological Survey
    Geographer
    384 Woods Hole Rd
    Woods Hole, MA 02543-1598
    USA

    508-548-8700 x2348 (voice)
    508-457-2310 (FAX)
    bandrews@usgs.gov

  3. What similar or related data should the user be aware of?

    Barnhardt, Walter A. , Andrews, Brian D. , and Butman, Bradford, 2006, High-Resolution Mapping of the Inner Continental Shelf: Nahant to Gloucester, Massachusetts: Open-File Report 2005-1293, U.S. Geological Survey, Coastal and Marine Geology Program, Woods Hole Science Center, Woods Hole, MA.

    Online Links:

    Ackerman, Seth D. , Butman, Bradford, Barnhardt, Walter A. , Danforth, William W. , and Crocker, James M. , 2006, High-Resolution Geologic Mapping of the Inner Continental Shelf: Boston Harbor and Approaches, Massachusetts: Open-File Report 2006-1008, U.S. Geological Survey, Coastal and Marine Geology Program, Woods Hole Science Center, Woods Hole, MA.

    Online Links:


How reliable are the data; what problems remain in the data set?

  1. How well have the observations been checked?

    The accuracy of this interpretive data layer is dependant on the level of detail of the source material and interpretation procedures.

  2. How accurate are the geographic locations?

  3. How accurate are the heights or depths?

  4. Where are the gaps in the data? What is missing?

    Survey data from USGS field activity numbers 05005 and 04015 were used as source data for these interpretations. The inshore boundary of this data layer extends shoreward of these source data. Source data for these shallow areas include aerial photographs and NOAA Nautical Charts. The aerial photographs were downloaded from MassGIS (<http://www.mass.gov/mgis/>).

  5. How consistent are the relationships among the observations, including topology?

    Topology was built to indentify any topological errors such as gaps between adjacent polygons. All topological errors were verified and corrected.


How can someone get a copy of the data set?

Are there legal restrictions on access or use of the data?

Access_Constraints: None
Use_Constraints:
The intended scale of these data is 1:25,000. Public domain data from the U.S. Government are freely redistributable with proper metadata and source attribution. Please recognize the U.S. Geological Survey (USGS) as the source of this information.

  1. Who distributes the data set? (Distributor 1 of 1)

    Brian Andrews
    U.S. Geological Survey, Woods Hole Science Center
    Geographer
    384 Woods Hole Rd.
    Woods Hole, MA 02543
    USA

    508-548-8700 x2348 (voice)
    bandrews@usgs.gov

  2. What's the catalog number I need to order this data set?

    Downloadable Data

  3. What legal disclaimers am I supposed to read?

    Neither the U.S. Government, the Department of the Interior, nor the USGS, nor any of their employees, contractors, or subcontractors, make any warranty, express or implied, nor assume any legal liability or responsibility for the accuracy, completeness, or usefulness of any information, apparatus, product, or process disclosed, nor represent that its use would not infringe on privately owned rights. The act of distribution shall not constitute any such warranty, and no responsibility is assumed by the USGS in the use of these data or related materials. Any use of trade, product, or firm names is for descriptive purposes only and does not imply endorsement by the U.S. Government.

  4. How can I download or order the data?

  5. What hardware or software do I need in order to use the data set?

    These data are available as a shapefile in Environmental Systems Research Institute (ESRI) format. The shapefile is distributed in a compressed format as a WinZip (ver. 9.0) To utilize these data, the user must be able to uncompress the WinZip file and have software capable of viewing ESRI shapefiles.


Who wrote the metadata?

Dates:
Last modified: 08-Jan-2009
Metadata author:
Brian Andrews
U.S. Geological Survey
Geographer
384 Woods Hole Rd.
Woods Hole, MA 02543-1598
USA

508-548-8700 x2348 (voice)
508-457-2310 (FAX)
bandrews@usgs.gov

Metadata standard:
FGDC Content Standards for Digital Geospatial Metadata (FGDC-STD-001-1998)
Metadata extensions used:


Generated by mp version 2.8.25 on Thu Jan 08 09:18:30 2009