National Water Availability and Use Program
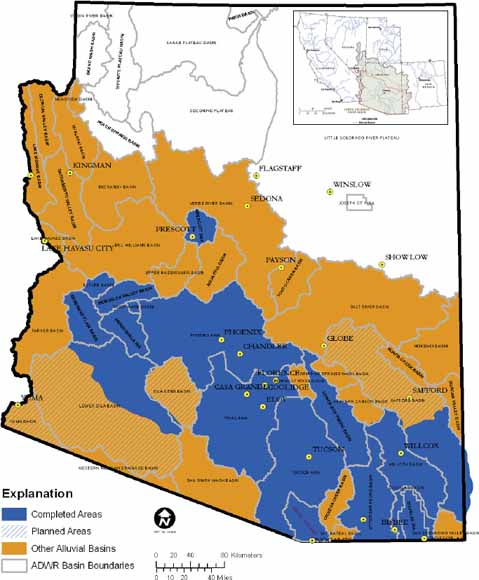
Map of Arizona showing basins with completed analyses of ground-water conditions and results made available on the interactive map service (IMS) (from figure 1).
Monitoring the availability of the nations ground-water supplies is of critical importance to planners and water managers. The general public also has an interest in understanding the status of ground-water conditions, especially in the semi-arid Southwestern United States where much of the water used by municipalities and agriculture comes from the subsurface. Unlike surface-water indicators such as stage or discharge, ground-water conditions may be more difficult to assess and present. Individual well observations may only represent conditions in a limited area surrounding the well and wells may be screened over single or multiple aquifers, further complicating single-well measurement interpretations. Additionally, changes in ground-water conditions may involve time scales ranging from days to many years, depending on recharge, soil properties and depth to the water table. This lack of an easily identifiable ground-water property indicative of current conditions combined with differing time scales of water-level changes makes the presentation of ground-water conditions a difficult task, particularly on a regional basis. One approach is to spatially present several indicators of ground-water conditions that address different time scales and attributes of the aquifer systems. In this report, we describe a publicly-available online interactive map service that presents several different layers of ground-water-conditions information for the alluvial basins in the Lower Colorado River Basin in Arizona (http://montezuma.wr.usgs.gov/website/azgwconditions/). These data layers include wells experiencing water-level decline, wells experiencing water-level rise, recent trends in ground-water levels, change in water level since predevelopment and change in storage since predevelopment. Recent pumpage totals and projected population numbers are also provided for ground-water basins and counties in the region of the Lower Colorado River in Arizona along with a bibliography of U.S. Geological Survey reports for those seeking further information. The methods used to create these data layers are explained with illustrations of example information available on the Web site.
Download the text for this report as a 20-page PDF file (of2007-1436.pdf; 8.1 MB)
For questions about the content of this report, contact Fred Tillman
Download the Suggested citation and version history
Download a free copy of the current version of Adobe Reader.
| Help
| PDF help
| Publications main page | Western Open-File Reports for 2007 |
| Water Resources | Arizona Water Science Center
|
This report is available only on the Web

![]() U.S. Department of the Interior | U.S. Geological Survey
U.S. Department of the Interior | U.S. Geological Survey
URL: https://pubs.usgs.gov/of/2007/1436/
Page Contact Information: Michael Diggles
Page Created: December 20, 2007
Page Last Modified: July 24, 2009