 |
|
| |||
| Ohio Water Science Center |
By Andrew D. Ebner, David E. Straub, and Jonathan D. Lageman
ONLINE ONLY
This report is available below as an 98–page PDF for viewing and printing.
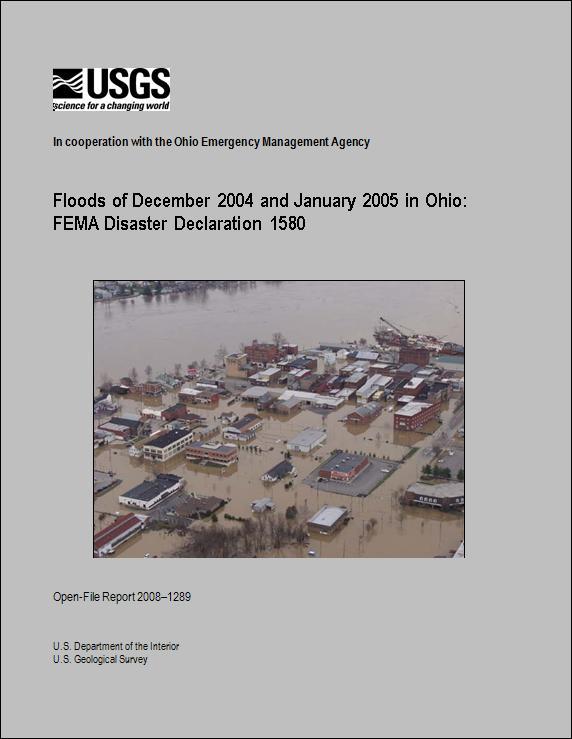
A large snowstorm at the end of December 2004 that left more than 20 inches of snow in some areas of Ohio, followed by unseasonably warm temperatures in early January 2005, caused snowmelt to begin filling river channels. Widespread rain showers during January 2005 combined with this snowmelt to cause flooding throughout Ohio and mudslides in some areas. Record peak streamflows occurred at nine U.S. Geological Survey (USGS) streamgages. Damages caused by the snowstorms, flooding, and mudslides were severe enough for 62 counties in Ohio to be declared Federal disaster areas. In all, approximately 3,664 private structures were damaged or destroyed, and an estimated $238 million in damages occurred.
This report describes the meteorological factors that resulted in severe flooding throughout Ohio between December 22, 2004, and February 1, 2005, and examines the damages caused by the storms and flooding. Peak-stage, peak-streamflow, and recurrence-interval data are reported for selected USGS streamgages. Flood profiles determined by the USGS are presented for selected streams.
Abstract
Introduction
Antecedent Climatic Conditions
December 2004–January 2005 Flood
Winter Storm of December 22–23, 2004
Storms of January 2005
General Description of the December 2004–January 2005 Flood
Areal Distribution
Flood Stages, Streamflows, and Recurrence Intervals
Flood and Storm Damages Associated with FEMA–1580–DR
Summary
Acknowledgments
References Cited
Appendix 1. Details of Hydrologic and Hydraulic Analyses
1-A. Wills Creek and Buffalo Creek near the Villages of Pleasant City, Derwent, and Kimbolton
1-B. Leatherwood Creek near the Village of Quaker City
1-C. Clear Fork near the Village of Birmingham
1-D. West Fork Duck Creek near the Villages of Ava, Coal Ridge, and South Olive
1-E. East Fork Duck Creek near the Village of East Union
1-F. Muskingum River near the City of McConnelsville
1. Map showing Ohio counties declared disaster areas under FEMA declaration 1580.
2. Maps showing regionally averaged monthly total precipitation and percentage
of normal precipitation for the
10 climatic regions of Ohio for A, November and B, December 2004.
3. Graphs showing mean 200-millibar heights (contour interval is 120 meters) and
wind speeds (shading, meters
per second) A, from December 22, 2004, through January 15, 2005, and B, for the climatological means calculated
from daily means for December 22–January 15 during 1979–1995.
4–15. Maps showing:
4. Distribution of 48-hour snowfall totals in Ohio for December 22–23, 2004.
5. Isohyetal map of rainfall totals in Ohio for January 2005.
6. Locations of selected U.S. Geological Survey streamgages referred to in this report.
7. Selected areas of central Ohio affected by flooding during December 2004 and January 2005.
8. Selected areas of northwestern Ohio affected by flooding during December 2004 and January 2005.
9. Selected areas of east-central Ohio affected by flooding during December 2004 and January 2005.
10. Selected areas of southeastern Ohio (16-county area) affected by
flooding during December 2004 and
January 2005.
11. Selected areas of southeastern Ohio (five-county area) affected by
flooding during December 2004 and
January 2005.
12. Selected areas of eastern Ohio affected by flooding during December 2004 and January 2005.
13. Selected areas of southwestern Ohio affected by flooding during December 2004 and January 2005.
14. Selected areas of central-northern Ohio affected by flooding during December 2004 and January 2005.
15. Selected areas of Tuscarawas County affected by flooding during December 2004 and January 2005.
1-A1–1-F1. Maps showing:
1–A1. Location of the Wills Creek study reaches for the Villages of Pleasant City and Derwent, Ohio.
1–A2. Location of the Wills Creek study reach for the Village of Kimbolton, Ohio.
1–B1. Location of the Leatherwood Creek study reach for the Village of Quaker City, Ohio.
1–C1. Location of the Clear Fork study reach for the Village of Birmingham, Ohio.
1–D1. Location of the West Fork Duck Creek Creek study reaches for the Villages of Ava and Coal Ridge, Ohio.
1–D2. Location of the West Fork Duck Creek study reach for the Village of South Olive, Ohio.
1–E1. Location of the East Fork Duck Creek study reach for the Village of East Union, Ohio.
1–F1. Location of the Muskingum River study reach near the City of McConnelsville, Ohio.
1-A3–1-A5. Graphs showing:
1–A3. Flood profiles for the Wills Creek and Buffalo Creek near the Village of Pleasant City for the 10-, 50-, 100-,
and 500-year-recurrence-interval floods.
1–A4. Flood profiles for Wills Creek near the Village of Derwent for the 10-, 50-, 100-, and 500-year-recurrence-
interval floods.
1–A5. Flood profiles for Wills Creek near the Village of Kimbolton for the 10-, 50-, 100-, and 500-year-recurrence-
interval floods.
1-A6–1-A8. Maps showing:
1–A6. Cross-section locations for the flood profiles on Buffalo and Wills Creek near the Village of Pleasant City, Ohio.
1–A7. Cross-section locations for the flood profiles on Wills Creek near the Village of Derwent, Ohio.
1–A8. Cross-section locations for the flood profiles on Wills Creek near the Village of Kimbolton, Ohio.
1-B2. Graph showing flood profiles for Leatherwood Creek near the Village of
Quaker City for the 10-, 50-, 100-, and
500-year-recurrence-interval floods.
1-B3. Map showing cross-section locations for the flood profiles on Leatherwood Creek near the Village of Quaker City, Ohio.
1-C2. Graph showing flood profiles for Clear Fork near the Village of Birmingham
for the 10-, 50-, 100-, and 500-year-
recurrence-interval floods.
1-C3. Map showing cross-section locations for the flood profiles on Clear Fork near the Village of Birmingham, Ohio.
1-D3–1-D5. Graphs showing:
1–D3. Flood profiles for West Fork Duck Creek near the Village of Ava for the 10-, 50-, 100-, and 500-year-
recurrence-interval floods.
1–D4. Flood profiles for West Fork Duck Creek near the Village of Coal Ridge for the 10-, 50-, 100-, and 500-year-
recurrence-interval floods.
1–D5. Flood profiles for West Fork Duck Creek near the Village of South Olive for the 10-, 50-, 100-, and 500-year-
recurrence-interval floods.
1-D6–1-D8. Maps showing:
1–D6. Cross-section locations for the flood profiles on West Fork Duck Creek near the Village of Ava, Ohio.
1–D7. Cross-section locations for the flood profiles on West Fork Duck Creek near the Village of Coal Ridge, Ohio.
1–D8. Cross-section locations for the flood profiles on West Fork Duck Creek near the Village of South Olive, Ohio.
1-E2. Graph showing flood profiles for East Fork Duck Creek near the Village of
East Union for the 10-, 50-, 100-, and
500-year-recurrence-interval floods.
1-E3. Map showing cross-section locations for the flood profiles on East Fork Duck Creek near the Village of East Union, Ohio.
1-F2. Graph showing flood profiles for the Muskingum River near the City of
McConnelsville for the 10-, 50-, 100-, and
500-year-recurrence-interval floods.
1-F3. Map showing cross-section locations for the flood profiles on Muskingum River near the City of McConnelsville, Ohio.
1. Precipitation totals and recurrence intervals for selected National Weather Service rain gages in Ohio for January 2005.
2. Areas and streams affected by flooding during December 2004–January 2005.
3. Peak stages, peak streamflows, and estimated recurrence-interval ranges
at selected U.S. Geological Survey streamgages
in Ohio, December 22, 2004–February 1, 2005.
4. Damage estimates for Individual Assistance associated with Federal
Emergency Management Agency disaster declaration
FEMA–1580–DR.
5. Damage estimates for Public Assistance associated with Federal
Emergency Management Agency disaster declaration
FEMA–1580–DR.
1–1. Summary of existing FIS(s) for selected streams in disaster area FEMA–1580–DR.
1–2. Summary of the explanatory-variable used in the regression equations and the resulting 10-, 50-, 100-, and 500-year
flood-peak discharge estimates.
1–3. Summary of the hydraulic model version and analysis date for each of the studied stream reaches.
1–A1. Summary of the hydraulic-structure solutions for the 10-, 50-, 100-, and 500-year profiles of Wills Creek near the Villages of
Pleasant City, Derwent, and Kimbolton.
1–A2. Comparison of published coordinates to USGS-surveyed coordinates and bench marks used in the study of Wills Creek near
the Villages of Pleasant City, Derwent, and Kimbolton.
1–B1. Summary of the hydraulic-structure solutions for the 10-, 50-, 100-, and 500-year profiles of Leatherwood Creek near the
Village of Quaker City.
1–B2. Comparison of published coordinates to USGS-surveyed coordinates and bench marks used in the study of Leatherwood Creek
near the Village of Quaker City.
1–C1. Summary of the hydraulic-structure solutions for the 10-, 50-, 100-, and 500-year profiles of Clear Fork near the Village of
Birmingham.
1–C2. Comparison of published coordinates to USGS-surveyed coordinates and bench marks used in the study of Clear Fork near
the Village of Birmingham.
1–D1. Summary of the hydraulic-structure solutions for the 10-, 50-, 100-, and 500-year profiles of West Fork Duck Creek near
the Villages of Ava and South Olive.
1–D2. Comparison of published coordinates to USGS-surveyed coordinates and bench marks used in the study of West Fork
Duck Creek near the Villages of Ava, Coal Ridge, and South Olive.
1–E1. Summary of the hydraulic-structure solutions for the 10-, 50-, 100-, and 500-year profiles of East Fork Duck Creek near
the Village of East Union.
1–E2. Comparison of published coordinates to USGS-surveyed coordinates and bench marks used in the study
of East Fork
Duck Creek near the Village of East Union.
1–F1. Comparison of published coordinates to USGS-surveyed coordinates and bench marks used in the study
of the
Muskingum River near the City of McConnelsville.
This document is available in Portable Document Format (PDF)
To view and print report you will need to use Adobe Acrobat Reader (available as freeware)
Users with visual disabilities can visit Online conversion tools for Adobe PDF documents web page
Covers (front and inside front cover) (60 KB) – (8.5" by 11" paper)
Main report (pages i–viii and 1–34) (3.24 MB) – (8.5" by 11" paper)
Appendix 1 (pages 35–98) (13.8 MB) – (8.5" by 11" paper)
Suggested Citation:
Ebner, A.D., Straub, D.E., and Lageman, J.D., 2008, Floods of December 2004 and January 2005 in Ohio—FEMA Disaster Declaration 1580: U.S. Geological Survey Open-File Report 2008–1289, 98 p.
For more information about USGS activities in Ohio, visit the USGS Ohio Water Science Center home page.
| AccessibilityFOIAPrivacyPolicies and Notices | |
 |
|